swissaustrian
Yellow Jacket
- Messages
- 2,049
- Reaction score
- 0
- Points
- 0
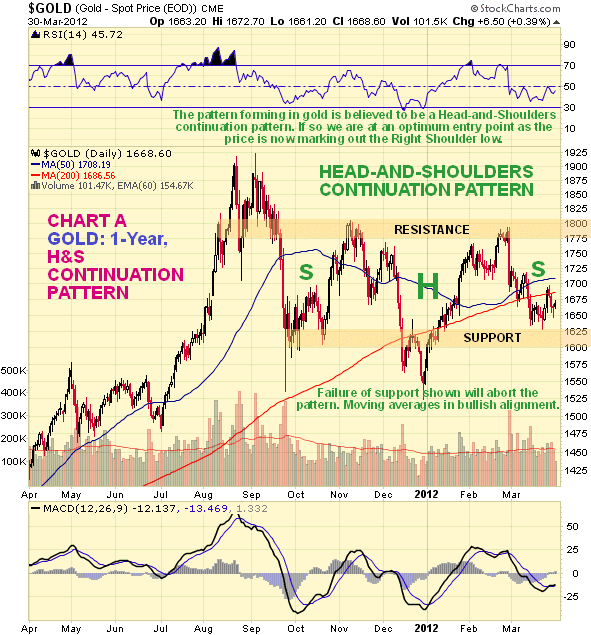
I'm currently on the road, so I'm not really in a position to perform a deep technical analysis, but here are some of my thoughts as of 3-6-12, 1:30 pm:
Gold fell below a key support level today at $1675. Next target would be $ 1630.
The 200 dma is at 1671.
Currently the 50 dma is rapidly approaching the 200 dma. If the 50dma falls below the 200dma, it would be short term bearish.
RSI went from overbought to oversold in just a few days. It has some way to go to the downside to be substantially oversold.
MACD is in neutral territory right now.
Chart

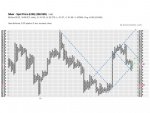
Silver
Silver fell below a key support level today at $33. Next target $ 30
The 200 dma is at $ 34.9.
Currently the 50 dma ($ 32.1) is rapidly approaching the 200 dma from the downside up (for gold, it's the other way arround). If the 50dma breaks the 200dma, it would be short term bullish, would require a rising price of silver, though.
RSI went from overbought to oversold in just a few days. It has some way to go to the downside to be substantially oversold.
MACD is in neutral territory right now.
Chart

In essence, the technical picture for gold and silver is generally the same. I expect one more downday, maybe down just intraday with a higher close than today.
Gold fell below a key support level today at $1675. Next target would be $ 1630.
The 200 dma is at 1671.
Currently the 50 dma is rapidly approaching the 200 dma. If the 50dma falls below the 200dma, it would be short term bearish.
RSI went from overbought to oversold in just a few days. It has some way to go to the downside to be substantially oversold.
MACD is in neutral territory right now.
Chart
Silver
Silver fell below a key support level today at $33. Next target $ 30
The 200 dma is at $ 34.9.
Currently the 50 dma ($ 32.1) is rapidly approaching the 200 dma from the downside up (for gold, it's the other way arround). If the 50dma breaks the 200dma, it would be short term bullish, would require a rising price of silver, though.
RSI went from overbought to oversold in just a few days. It has some way to go to the downside to be substantially oversold.
MACD is in neutral territory right now.
Chart
In essence, the technical picture for gold and silver is generally the same. I expect one more downday, maybe down just intraday with a higher close than today.


")