All the Metals We Mined in One Visualization

Welcome to the Precious Metals Bug Forums

Welcome to the PMBug forums - a watering hole for folks interested in gold, silver, precious metals, sound money, investing, market and economic news, central bank monetary policies, politics and more. You can visit the forum page to see the list of forum nodes (categories/rooms) for topics.

Why not register an account and join the discussions? When you register an account and log in, you may enjoy additional benefits including no Google ads, market data/charts, access to trade/barter with the community and much more. Registering an account is free - you have nothing to lose!

pmbug

Your Host
Administrator
Benefactor
Messages
14,411
Reaction score
4,544
Points
268
Location
Texas
United-States
VCE_All_the_Metals_We_Mined_2022-Nov-14-1.jpg


...
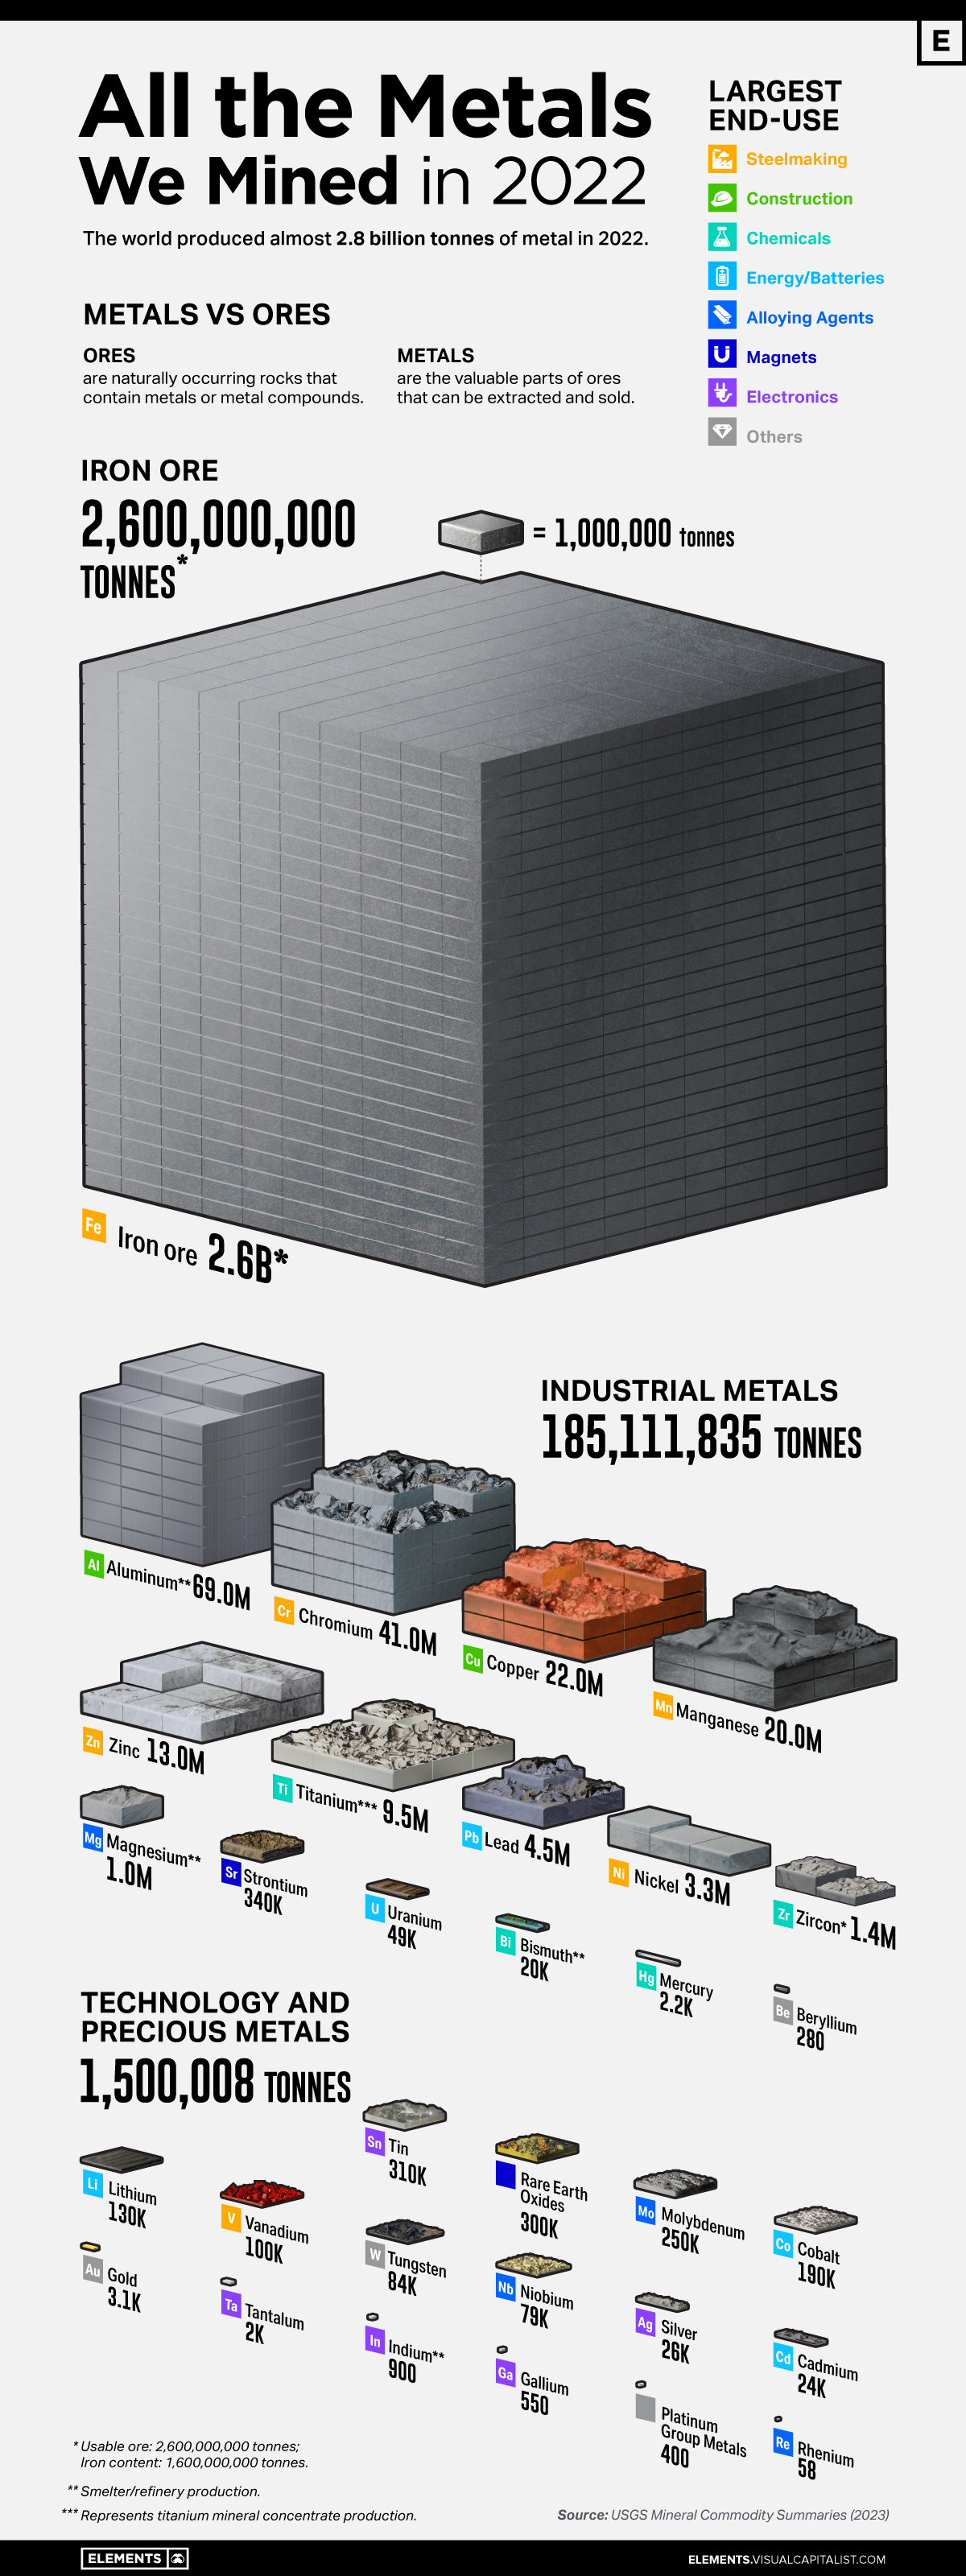
The above infographic visualizes all 2.8 billion tonnes of metals mined in 2022 and highlights each metal’s largest end-use using data from the United States Geological Survey (USGS).
...

More:


Silver represented 1.7% of all mined metal and gold represented 0.2%.
 
Back
Top Bottom