swissaustrian
Yellow Jacket
- Messages
- 2,049
- Reaction score
- 0
- Points
- 156
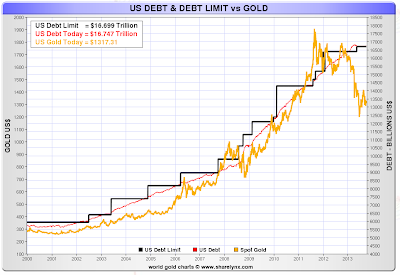
This chart isn´t new, it´s from late july 2011 BEFORE the debt ceiling hike.
I think it´s a good tool to put into perspective where we are right now. Gold had it´s spike up to 1923 right after the debt ceiling deal and S&P downgrade. It fell of a cliff thereafter. If you expect no further debt ceiling hikes in the future, it might be time to sell. If otherwise you do expect more debt, BTFD :wave:
2008 basicly mirrors 2011 by the way: Gold shot up, corrected massively (30 %) and then doubled in two years.