Investment demand vs. Industrial demand

Welcome to the Precious Metals Bug Forums

Welcome to the PMBug forums - a watering hole for folks interested in gold, silver, precious metals, sound money, investing, market and economic news, central bank monetary policies, politics and more. You can visit the forum page to see the list of forum nodes (categories/rooms) for topics.

Please have a look around and if you like what you see, please consider registering an account and joining the discussions. When you register an account and log in, you may enjoy additional benefits including no ads, market data/charts, access to trade/barter with the community and much more. Registering an account is free - you have nothing to lose!

pmbug

Your Host
Administrator
Benefactor
Messages
13,942
Reaction score
4,356
Points
268
Location
Texas
United-States
Found this chart while browsing around:
Investment+demand.png

Investment demand is now* greater than industrial demand for silver.

* well it was in 2010 and all indications are that investment demand in 2011 is even greater than it was in 2010

Oh - and industrial demand has apparently been increasing too:

Industrial+demand.png
 
I'm not worried about the "what if industry sells all it's silver in an economic crash" argument.

Fundemental investment/monetary demand is so high as it is, that a sell off by industry would drop prices temporarily and all the investment bulls would just say THANK YOU and fill the void.
 
One of the fastest growing industrial uses for silver is in solar panels - an industry that government has chosen to subsidize and support (for now at least). I would think that, plus "loony survivalists"* looking for off grid power solutions, should provide some support for industrial demand.

*looks in mirror
 
Dont forget 15Kg Ag in every Tomahawk missile (or so Im told). We must have gone through a few over the past year in Libya.
 
On the first day of strikes alone, U.S.-led forces launched 112 long-range Tomahawk cruise missiles, which cost about $1 million to $1.5 million apiece, from ships stationed off the Libyan coast. That totals $112 million to $168 million for the first day's missile strikes alone. Since the first strikes, U.S. and British forces have launched at least another 12 Tomahawk missiles.

source
 
For months now the Lowly Bearing has been screaming in The Wilderness for a knowledgeable Silver Expert to write a piece for my blog! I am more of a gold guy, but I want those who KNOW a lot about silver and are REALLY BULLISH to write up a piece something like:

"The Case For Silver"

I have seen a lots there at Zero Hedge who say the gold / silver ratio will come back down to its traditional range of approx. 15 / 1. I have seen some say it will go much lower than that (that is, silver will way outperform gold), a couple have even said we may get to 1 / 1... I believe their main arguments also center on both the increasing demand for and falling supply of silver.

Anyone up to the task and want to write it? Let me know...
 
Last edited:
The issue with the GSR is that most of the silver used in industrial applications is "lost" - unrecoverable / unreclaimable, at least economically, in landfills with other trash. Stocks of above ground / mined silver have been declining for years (decades?) as the price was low and industrial demand took off.

Gold on the other hand is mostly still "in play". Stocks of above ground / mined gold are still circulating or in a vault somewhere. So, while gold is rarer than silver in the earth, when you look at the stock of available metals and the current rate of mining production, available silver is currently much more scarce than available gold.

At least, that's what everyone seems to believe. I'm not sure that central bank gold sitting in vaults should really be considered as available to the open markets though. They seem to only sell, lease, etc. gold amongst themselves.

If silver were to be remonetized, I would buy the argument that the GSR will hit or break 15:1. The GSR was down to ~33:1 back in May before the CME dropped the hammer on it without any hint of remonetization, so it's not hard to imagine what would happen if central banks started investing heavily in it.
 
...
The latest annual figures reveal that in 2010 over 487 million ounces of silver were used for industrial applications, 167 million ounces were used by the jewelry market, over 50 million ounces producing silverware and over 10 million ounces in minting coins and producing medals.
...

http://seekingalpha.com/article/306118-silver-set-to-reach-new-highs

I wish I could figure out how people are sourcing these figures. Those numbers are significantly higher than the Casey research numbers in the second chart in the OP. Also, the US Mint sold 34 million bullion Silver Eagles last year, so the numbers are definitely suspect (34 million doesn't include proofs or other silver coins like the 5oz ATB coins).
 
There was some interesting information posted in the comments across different articles on ZH this morning on this subject. First, in response to my comment, JLee2027 offered the following link:

http://www.silverinstitute.org/supply_demand.php

which contains this chart:

demand11.jpg


Notice the source, GFMS, is the same as for the initial chart in the OP of this thread. Notice that it does not show the same picture for investment demand. Very strange.

Next, SRSrocco offered up the following comment in a different topic:
...
On a different tangent...there is this so called notion that in the past several years there has been a SURPLUS OF SILVER. The GFMS- World Silver Survey is the one that comes up with these figures. The reason why we have had a so called LARGER SURPLUS is due to taking COIN & MEDAL out of the Fabrication figures. The coin & medal figure is included in the total fabrication number, but they have decided to take it out.

GFMS Calculation for Deficit-Surplus Silver:

Mine Production +Scrap - Fabrication (plus Coin & Medals) = Deficit-Surplus

Here is the 2010 figures:

735.9 mil + 215 mil - 878 + 101.3 = 174.2 million surplus

---------------------------------------------------------------

GMFS believes that coin & medal count as new bullion demand. So the higher the amount of silver that goes into COIN & MEDAL acutally adds to the so called surplus. Silly isn't it? Most of this coin production is from Govt mints making Eagles, Maples, Philharmonics, Pandas, Kookaburras and etc. Most people who own these are not going to sell them for melt.

So, 101.3 million ounces worth of coin and medal in 2010 accounted for 58% of the so called surplus. This year in the 2011 Interim Silver Market Report, GFMS says that coin & medal demand will increase 25 million. That would give us a ballpark of about 126 million ounces to coin & medals. This will be added to increase the surplus in 2011.

Also, the Scrap silver which comes from recycling industrial silver is part of the Supply. Why does GFMS not take this out as it is also a form of bullion... scrap maybe, but supply that does come back into the market. Interesting...

GFMS STATES GLOBAL SILVER PRODUCTION WILL RISE IN 2011

I had an email exchange with Oliver Heathman, metals analyst at GFMS and they believe global silver production with increase 30 million ounces in 2011 or 4% above last year. In my research I thought we would see a decline in 2011 and I have posted a few comments here to that effect. Australia, Peru, Chile and the United States will come in lower, but Mexico, Russia, and China are higher.

GFMS's 2010 Interim Silver Market Report showed a higher global silver production in 2010 than its final report. I believe they will be wrong by at least 15 million. Anyhow, I wrote that article Peak Silver Revisited: Impacts of a Global Depression, Declining Ore Grades & a Falling EROI, where I believe we are going to see a peak in silver soon.

Anyhow, this so called surplus is really a joke when you figure just how little silver the world owns.

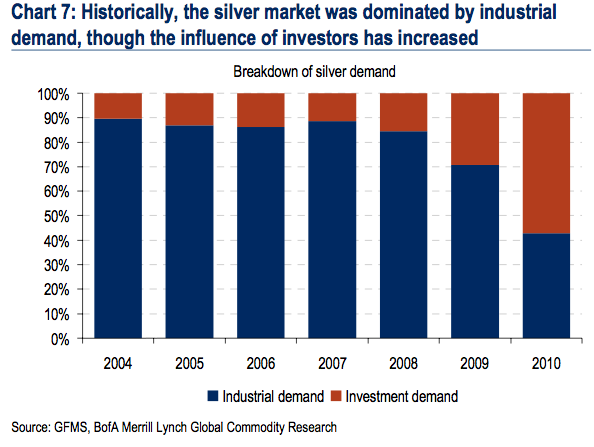
Lastly, when we had a deficit in silver, we also had LOW SILVER PRICES. As this so called silver surplus went higher, so did the price of silver. REASON? It was investment demand that pushed the price higher, not industrial demand. This will be the very reason why we see much higher silver prices when the system implodes.
 
SRSrocco posted a follow up in response to my request:
... I checked out those charts and have to say the first one [edit: he means the chart in the OP of this thread] does not make sense. If we go to the silver institute's supply/demand page we see that industrial applications alone accounted for 487.4 million ounces of silver. Then they have the following:

Photography = 72.7

Jewelry = 167.0

Silverware = 50.3

Coins & Medals = 101.

---------------------------------------

then on the bottom of their chart they have what is termed IMPLIED NET INVESTMENT at 178.0 million ounces. If we were to add this plus Coin & medals we would get 279.3 million ounces. I don't know how GFMS who was sighted on the bottom of that chart stated that investment demand is higher when their own figures show otherwise.

If the first chart you linked was included jewelry and silver ware as investment rather than fabrication demand it would turn out to be this:

279.3 + 167 + 50.3 = 496.6 million

Compare that with plain on Industrial Application at 487.4 million ounces and we still can't get to that 55% investment demand figure. Now, there could be more demand of silver above and beyond what is show in NET IMPLIED INVESTMENT DEMAND. I have read several articles about this.

In the end...who the hells knows. I am surprised GFMS is listed as a source on that chart when we can see their information on the silver institute refutes this.

I guess the best we can do is buy and hold physical silver and gold and watch the GRAND FIAT MONEY SYSTEM IMPLODE at a safe distance from us. We will know it's time when the FIAT PHAT LADY SINGS...

http://www.zerohedge.com/news/eric-...s-retain-silver-produced-cash#comment-1966201


The video cites an article posted by SRSrocco on ZH. When he caught my attention yesterday, I didn't realize he was such a well known commenter on this subject. I must have missed this when it was originally posted a few months ago:
The world is about to peak in global silver production. This will not occur due to a lack of silver to mine, but rather as a result of the peaking of world energy resources, declining ore grades, and a falling Energy Returned On Invested – EROI. The information below will describe a future world that very few have forecasted and even less are prepared. This is an update to myprevious article Peak Silver and Mining by a Falling EROI. In my first article I stated that global silver production may peak in 2009 if we were to enter a worldwide depression. We did not have the global depression as massive central bank printing and bailouts have thus far postponed the inevitable.
...

http://www.zerohedge.com/news/peak-...-depression-declining-ore-grades-falling-eroi

Sounds like he is on the same page with Chris Martenson.
 
One of the fastest growing industrial uses for silver is in solar panels - an industry that government has chosen to subsidize and support (for now at least). I would think that, plus "loony survivalists"* looking for off grid power solutions, should provide some support for industrial demand.

*looks in mirror

That brings up a scary scenario for me, one I haven't mentioned before.

1) The Fed, along with other central banks and governments, are making - literally enthroning - gold as the reserve currency. By their actions and not their words.

2) Competing currencies are anathema to currency Ponzi schemes. Destroying competing currencies is a number one priority, legal tender laws being only one means to that end.

3) Silver is the number one competing currency of gold and fiat currencies (regardless of their so-called "backing").

4) Silver is needed for consumption in industrial uses, including "green" technologies and growing "medical" uses.

I could foresee a scenario where silver is destroyed as a competing currency, not by legal tender laws, but by giving it a quasi-sacred "eminent domain-like" status, declared off limits as a currency fer da gud of da klymatt and da peephole; as the silver "hoarders" get politically vilified as greedy people who do not care about saving lives or the environment - who are forced to sell it on the cheap...taking one for "the team".

Governments and central banks win, as the new "gold backed" (but not gold redeemable) fiat currency kills its number one competition once and for all, as all the future silver mined is presumed to be slated for consumption only.

I am not calling it probable - but it is at least plausible, and certainly not out of the realm of human lunacy possibilities we have concocted thus far.
 
The video cites an article posted by SRSrocco on ZH.

Well, after hearing him quote the numbers, I thought it would be interesting to plot the four data points to see if the above-ground bullion silver supply has been on a steady rate of decrease or perhaps if rate has been slowing down. It looks like the rate of decline has not really changed much since 1950. Also on the graph is a straight-line fit, extrapolated to where it goes to zero.

This graph shows that D-day for silver supplywill be around the start of 2014 if the decline continues at the current rate.

I would like to read more about this topic. Does anyone know where one can go to find the source data that he mentioned in the video and that is plotted in this graph?
 

Attachments

  • silver supply.jpg
    silver supply.jpg
    51.2 KB · Views: 8
Last edited:
SRSrocco is working on a new article and posted a preview at the Silver Doctor's blog:
The Frisco mine later named the HORN SILVER MINE, was founded in 1875 ...
...
The most interesting part of researching the Horn Silver Mine in Frisco was finding out the tremendously high silver ore grades they were mining. When the mine first opened they were producing silver at a staggering 1,608 grams per ton (51.7 oz per ton). We must remember, at this time, the United States was figuring these ore grades by short tons or 2,000 pounds. The industry standard today is metric tonnes or 2,205 pounds. Thus, the earlier figures were 10% lower than the grades today. If we add that 10% to this figure we see that compared to present mining ore grades it would have been 56.8 ounces per metric tonne — or 1,769 grams per tonne.

Visiting the mine in person, gave me the inspiration to write this article. I looked at several present silver mines and decided to compare the Horn Silver Mine with First Majestic. The chart below gives the STARK COMPARISON of how times have changed in 100 years.

Horn-Silver-Mine-vs-First-Majestic-Silver-Production-Ore-Grade.png

...

More: http://www.silverdoctors.com/future-silver-supply-more-at-risk-than-gold/
 
Silver prices last Friday hit a new 19-month low as both industrial and investment demand for the precious metal has slowed. Silver for July delivery settled at $26.661 per troy ounce Friday, the lowest since November of 2010. The recent decision by the Federal Reserve to not pursue aggressive stimulus measures has reduced investment demand for safe havens, gold and silver. "In light of silver industrial demand slowing down and investment demand failing to plug the gap, it is the precious metal most vulnerable on the downside," Barclays' Suki Cooper said in a note.
 
Silver prices last Friday hit a new 19-month low as both industrial and investment demand for the precious metal has slowed.

IMO, you need to differentiate between demand for "paper silver" and physical silver. The paper markets have been subdued ever since the CME margin busting bullshit back in May 2011 and of course MF Global, PFGBest, etc. It's much harder to measure demand in the physical markets, but rumors are persistent that silver is hard to acquire in good delivery bar form right now.

... The recent decision by the Federal Reserve to not pursue aggressive stimulus measures ...

Say what? $40B/month is not aggressive?
 
Back
Top Bottom