AGgregator
Fly on the Wall
- Messages
- 14
- Reaction score
- 10
- Points
- 13

Using the present month's contract SIQ26 (Silver-August) as an example, I became curious as to what the ratio of House Stopped Contracts to Customer Stopped has occurred in Nick Laird's dataset. The presumption was that the House Accounts either wanted the Metal or if Exchanged for Physical or fiat the gain in $value. This month is extremely lop-sided towards House Stopped Contracts by ratio, less so, in total ounces.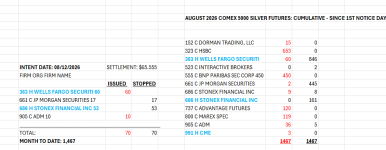
Or looked at a different way
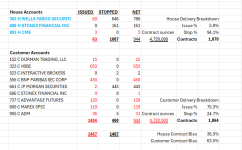
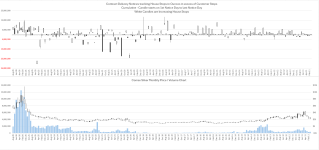
So, if one goes back a couple years, the pattern shows a House Stop bias. (No big surprise) The comparison is the number of ounces of House Stops less Customer Stops and since the contracts net to zero, the same difference in Customer Issues less House Issues. In the above graphic, the 944 contract House Stop bias and same in Customer Issues.
In a candle format, 1st Notice Day is the bottom of the white candles and the top of the black candles. As the month progresses, the ratio changes, but in general the House Stop ratio usually is above zero and usually increases.
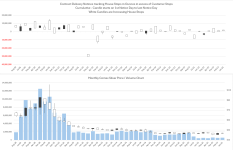 There doesn't seem to be any direct correlation to price/volume, and here's the dataset going back to 2011
Or looked at a different way
So, if one goes back a couple years, the pattern shows a House Stop bias. (No big surprise) The comparison is the number of ounces of House Stops less Customer Stops and since the contracts net to zero, the same difference in Customer Issues less House Issues. In the above graphic, the 944 contract House Stop bias and same in Customer Issues.
In a candle format, 1st Notice Day is the bottom of the white candles and the top of the black candles. As the month progresses, the ratio changes, but in general the House Stop ratio usually is above zero and usually increases.
There doesn't seem to be any direct correlation to price/volume, and here's the dataset going back to 2011