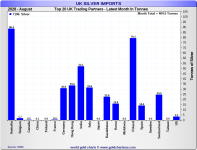


As most of of you who have followed me for a while know, I capture, monitor and analyze a lot of data pertaining to vault stock flows - both exchange vault stock reports and customs import/export data for the USA, UK et al.
I have a spreadsheet that calculates several estimating factors which I use to forecast end of month LBMA silver inventory based upon COMEX withdrawals and UK-USA imports/exports. That spread sheet now encompasses data from October 2025 through June 2026.
One of the metrics that I'm calculating on a month by month basis is:
UK silver imports from the USA / COMEX withdrawals
This tells me how much of the silver withdrawn from the COMEX was likely exported to the UK.
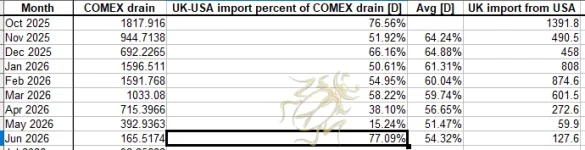
I was updating this spreadsheet this morning and thought the pattern was a bit interesting. From October through March, the percentage stayed in a fairly tight range with the average between 60% and 65% (which is great for confidence level in using this metric as an estimating factor).
However, in April and May, the vast majority of silver leaving the COMEX did not get exported to the UK. USA export data for April and May indicate that export tonnage in those months were less than the tonnage withdrawn from the COMEX, so the silver was not flowing to other countries either.
That brings us to June (the most current month for which we have customs import/export data). In June, the percent of silver withdrawn from the COMEX that was exported to the UK jumped to the highest percentage since I've been watching this - higher than back in October 2025, which I will remind you was when the LBMA ran dry of liquid free float and required emergency shipment of silver from the COMEX to continue functioning (as silver lease rates blew out, the wholesale market stopped using the LBMA spot for pricing quotes, etc.).
Silver lease rates did not rise in June/July to indicate any problem with LBMA free float vault stock, but it is curious that the percent of COMEX silver exported to the UK rose so dramatically in June.
I've attached a screenshot of my spreadsheet for context (sorry about the order of the columns - I'm sure you can figure it out though).
I have a spreadsheet that calculates several estimating factors which I use to forecast end of month LBMA silver inventory based upon COMEX withdrawals and UK-USA imports/exports. That spread sheet now encompasses data from October 2025 through June 2026.
One of the metrics that I'm calculating on a month by month basis is:
UK silver imports from the USA / COMEX withdrawals
This tells me how much of the silver withdrawn from the COMEX was likely exported to the UK.
I was updating this spreadsheet this morning and thought the pattern was a bit interesting. From October through March, the percentage stayed in a fairly tight range with the average between 60% and 65% (which is great for confidence level in using this metric as an estimating factor).
However, in April and May, the vast majority of silver leaving the COMEX did not get exported to the UK. USA export data for April and May indicate that export tonnage in those months were less than the tonnage withdrawn from the COMEX, so the silver was not flowing to other countries either.
That brings us to June (the most current month for which we have customs import/export data). In June, the percent of silver withdrawn from the COMEX that was exported to the UK jumped to the highest percentage since I've been watching this - higher than back in October 2025, which I will remind you was when the LBMA ran dry of liquid free float and required emergency shipment of silver from the COMEX to continue functioning (as silver lease rates blew out, the wholesale market stopped using the LBMA spot for pricing quotes, etc.).
Silver lease rates did not rise in June/July to indicate any problem with LBMA free float vault stock, but it is curious that the percent of COMEX silver exported to the UK rose so dramatically in June.
I've attached a screenshot of my spreadsheet for context (sorry about the order of the columns - I'm sure you can figure it out though).