


I saw the following question, got curious and checked:
Silver (and gold) got the monkey hammer near the end of January:
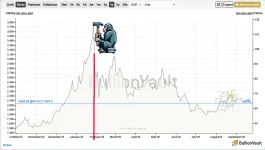
COMEX silver is down 73,597,271.7 ozt or ~18% since the end of January:
Jan 30 - 405,697,594.39
May 8 - 312,116,807.55 (low for the year just before India stopped importing silver)
Sep 23 - 332,100,322.69
COMEX gold is down ~12,443,673.93** ozt or ~35% since the end of January:
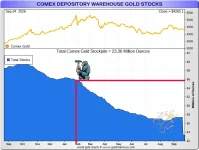
Jan 30 - ~35,800,000 ozt (estimated from @goldfishcharts chart)
Sep 23 - 23,356,326.07* (low for the year even adding 4M ozt for the asterisk)
* This total missing 4,059,364.4 ozt of "Enhanced Delivery" vault stock that was delisted. The status of this missing 4M ozt of gold has not been publicly reported AFAIK.
** Down 8,384,309.53 ozt or ~26% if we discount the 4M ozt "Enhanced Delivery" from the Jan 30 total.
Silver (and gold) got the monkey hammer near the end of January:
COMEX silver is down 73,597,271.7 ozt or ~18% since the end of January:
Jan 30 - 405,697,594.39
May 8 - 312,116,807.55 (low for the year just before India stopped importing silver)
Sep 23 - 332,100,322.69
COMEX gold is down ~12,443,673.93** ozt or ~35% since the end of January:
Jan 30 - ~35,800,000 ozt (estimated from @goldfishcharts chart)
Sep 23 - 23,356,326.07* (low for the year even adding 4M ozt for the asterisk)
* This total missing 4,059,364.4 ozt of "Enhanced Delivery" vault stock that was delisted. The status of this missing 4M ozt of gold has not been publicly reported AFAIK.
** Down 8,384,309.53 ozt or ~26% if we discount the 4M ozt "Enhanced Delivery" from the Jan 30 total.
