

All vault stock quoted in metric tons:
Baseline
F Vault Stock = 28,675 ( from 28,431)
F Free Float (FF) = 7,025 (from 6,988)
F Liquid (LFF) = 7,025 FF - 3421 illiquid = 3,604
Realistic
F' Vault Stock = 28,308 ( from 28,431)
F' Free Float (FF) = 6,657 (from 6,988)
F' Liquid (LFF) = 6,657 FF - 3421 illiquid = 3,236
At a spot price of $70/ozt, LFF = ~$7.28B to ~$8.11B
The LBMA is due to report their end of September silver stock report on October 7. LBMA dinosaurs apparently need 5 business days to figure out their end of the month total vault stock and even with that time, their report is not always consistent with UK silver import/export data. I calculate my own forecast estimate to keep the LBMA honest.
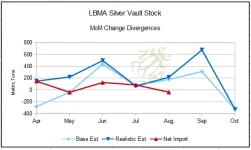
Last month, the LBMA came in 176 metric tons over my baseline and 213 metric tons over my "realistic" estimates. Once again, when we got July UK import/export data, the LBMA report was ~83 metric tons more than what was imported.
X = A - B + (((C * D) / E) * F)
X = LBMA free float vault stock
A = (28,431) LBMA vault stock (previous month)
B = (21,650.82) ETF London vault stock as of Sep 30/Oct 1
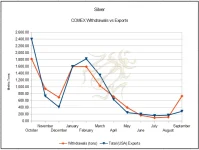
C = (731.08) COMEX withdrawn for September
D = (0.5042from 0.5432) Estimated % of COMEX Withdrawn that was exported to London
E = (0.5167from 0.5661) Estimated % of total UK silver imports that came from the USA
F = (0.3426) Estimated % of NET (accounting for exports) UK monthly imports represented by UK monthly imports - Avg Oct-Jul
F' = (-0.1725) Estimated % of NET (accounting for exports) UK monthly imports represented by UK monthly imports - Avg Jan-Apr (when India was actively importing silver)
Note: India restarted importing silver in August. My "F" factor represents a baseline average including months where India was and was not actively importing. The "F'" factor represents only the months where India was actively importing silver and should yield a more realistic estimate.
I did not adjust the LBMA vault stock ("A" factor in the formula) downwards according to the previous months of import discrepancies. If we factored the discrepancies for Feb-Apr + Jun-Jul, the LBMA vault stock would be ~856 metric tons lower (that represents ~24% of the estimated LFF).
Baseline
F Vault Stock = 28,675 (
from 28,431)F Free Float (FF) = 7,025 (
from 6,988)F Liquid (LFF) = 7,025 FF - 3421 illiquid = 3,604
Realistic
F' Vault Stock = 28,308 (
from 28,431)F' Free Float (FF) = 6,657 (
from 6,988)F' Liquid (LFF) = 6,657 FF - 3421 illiquid = 3,236
At a spot price of $70/ozt, LFF = ~$7.28B to ~$8.11B
Big Picture
The LBMA is due to report their end of September silver stock report on October 7. LBMA dinosaurs apparently need 5 business days to figure out their end of the month total vault stock and even with that time, their report is not always consistent with UK silver import/export data. I calculate my own forecast estimate to keep the LBMA honest.
Last month, the LBMA came in 176 metric tons over my baseline and 213 metric tons over my "realistic" estimates. Once again, when we got July UK import/export data, the LBMA report was ~83 metric tons more than what was imported.
Formula (Updated Factors through July)
X = A - B + (((C * D) / E) * F)
X = LBMA free float vault stock
A = (28,431) LBMA vault stock (previous month)
B = (21,650.82) ETF London vault stock as of Sep 30/Oct 1
C = (731.08) COMEX withdrawn for September
D = (0.5042
from 0.5432) Estimated % of COMEX Withdrawn that was exported to LondonE = (0.5167
from 0.5661) Estimated % of total UK silver imports that came from the USAF = (0.3426) Estimated % of NET (accounting for exports) UK monthly imports represented by UK monthly imports - Avg Oct-Jul
F' = (-0.1725) Estimated % of NET (accounting for exports) UK monthly imports represented by UK monthly imports - Avg Jan-Apr (when India was actively importing silver)
Note: India restarted importing silver in August. My "F" factor represents a baseline average including months where India was and was not actively importing. The "F'" factor represents only the months where India was actively importing silver and should yield a more realistic estimate.
Commentary
I did not adjust the LBMA vault stock ("A" factor in the formula) downwards according to the previous months of import discrepancies. If we factored the discrepancies for Feb-Apr + Jun-Jul, the LBMA vault stock would be ~856 metric tons lower (that represents ~24% of the estimated LFF).