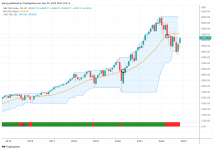
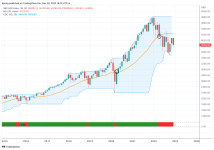
Monthly Retirement Slow-Trade system

Welcome to the Precious Metals Bug Forums

Welcome to the PMBug forums - a watering hole for folks interested in gold, silver, precious metals, sound money, investing, market and economic news, central bank monetary policies, politics and more.

Why not register an account and join the discussions? When you register an account and log in, you may enjoy additional benefits including no Google ads, market data/charts, access to trade/barter with the community and much more. Registering an account is free - you have nothing to lose!

dpong

Audacity, Tenacity, Veracity.
GIM2 Refugee
Messages
372
Reaction score
833
Points
268
The GIM2 crowd may be tired of hearing about my Monthly Retirement Slow-Trade system. But since we are on a new (to us) platform, I will explain it a little.

It is designed to accommodate the limitations of certain retirement accounts. For example my retirement accounts have restrictions against frequent trading. If you move out of an equity fund, they do not let you move back into that equity fund for 30 (and sometimes 60) days. So this can't be a short term trading system.

To meet that requirement I use a monthly chart of the S&P 500. I feel like I made this up, but I think I must have heard about it somewhere, and I subsequently went and researched and it really is "a thing."

The thing is the following. At the close of each month: When the monthly price closes the month above the 20 month moving average, you move to stock funds. When the monthly price closes the month below the 20 month moving average, you move back to cash.

It sounds too simple, but historically it has done very well. I'll prove that later.

Some people ride the market all the way back down when the bear comes. I can't do that and sleep at night. So this system is designed to let me participate in the SM without pulling my hair out.

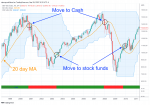
It is specifically designed to avoid big bear moves like starting about 2000 and also 2008. Those "pullback" (LOL) are show here:
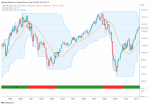
SPX_2022-09-29_16-32-28.png
 
Last edited:
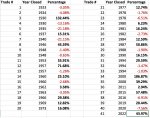
Starting in 1920 up until the present, this Monthly Retirement Slow Trade system would have completed only 41 sales.

The track record would look like the following table. Compare (mentally) the Percentage gains in Black vs. the Percentage losses in Red.

It's not a bad track record for such a simple system, historically at least.

[And I can sleep at night.]

I'm currently sitting in cash in my retirement accounts because of this system. I basically made the 43.97% trade which is number 41, and now am in cash. Tomorrow is the last day of September, so I'll post up my results from sitting out the last several months. [Tomorrow.]


Window_and_SnP500_Slow_Trade_Backtest_Results-2.jpg
 
Last edited:
We mix it up in the Lunatic Fringe. That's the point.

This system is so simple, 20 month moving average. Done!
 
My accounts have been taking some serious hits.
I have to stay in the game to recover
My system is designed to avoid your exact situation. Look it over, think about it (for next time). Couldn't be simpler. After today's close I'll post the chart showing where I sold and where we are now.

All my friends say "I don't want to look."

[But it is easy to avoid this.]
 
Reading the chart it looks as if you've made only 4 trades since 2000.

It that correct?
 
There are 4 trades on that chart, but that chart ends in 2011. That chart was to show the 2 major crashes.
This evening I will post the more current chart.
Look at the spreadsheet to see how many trades and when the sells occurred.

[Starting in 2000, there have been 8 trades.]

[So that's about 8 trades in 20 years. Thus the word SLOW in the title.]
 
Last edited:
September closed in weakness.

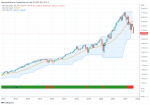
In the spreadsheet I posted earlier, the 41st trade was a gain of 43.97%. That trade is shown on the current chart. I bought at the first little black circle and sold at the second black circle for a gain of 43.97%.

The high in January was 4818.62, and I've calculated what the graph shows is that I gave back 14.27% off of that high before I sold.

If one had not sold but is currently holding, then one would have given back 25.57% off of that January high as of the September close. And there is no guarantee (or even hint) that it won't go lower before going higher again.

[I've been out of the stock market now for 5 complete months.]

Although they are not circled on the chart, you can see some other instances where we would have sold the SPX only to buy back 1 or 2 months later. Those are inconvenient and annoying. However, it seems worth it to avoid the bigger losses.

Anyway, this is what my Monthly Retirement Slow Trade system does. I say I don't want to own it below the 20 month moving average.

SPX_2022-09-30_16-01-49.png
 
Last edited:
Thanks for the thread, dpong, your info is valuable to me. I, too, am stuck with a 401k retirement account that has fairly limited options. Vanguard pushes their Target Retirement Date funds, as well as “professional management “, which I found out was just a run-of-the-mill asset mix that you can find in just about every issue of the financial rag of your choice. After signing up for the service, and watching them move towards the vanilla asset mix, the Vanguard rep locked up when I asked if he knew who Jack Bogle was and that he was adamant that the average investor (people like me) had no business dabbling in international stocks. I immediately took control of my account back.

All that said, the Play in my investment options is company stock, which is a domestic Oil and Gas Major. While not a smart man, my grade-school level observations over time reflect exactly what you are talking about, so I try to play the stock that way. Covid ended up being the best thing that ever happened to my 401k balance, and that was largely by dumb luck. I had bought company stock at a low, thinking I was being smart, and that happened to be when the world started falling apart. I sold everything after losing $15/share because my gut told me that the storm had only started. Coworkers thought I was crazy. “You’re losing money!” I said that I thought we had just begun to lose, and company stock dropped another $35/share. Rode Stable Value for awhile and had to send it a hard copy buy request because I was within the 30 day lock to move back into company stock. They bought me back in at the very bottom. Once in a lifetime outhouse luck.
 
I'll record the journey of the Slow-Trade system here. Maybe someone somewhere will be helped by it.

[I'll still post in the Fringe. That's why I'm here.]

It deserves it's own space so people can flow the progress more easily... you know, once all the loonies stop chiming in.
 
Take a small loss before it becomes a big loss.
This rhymes with catching the 20%.

You can make money if you can hop on at 20% of the bottom and out at 20% of the top. Words to that?

Most folks do NOT get out when the gittin is good. I fit that to a "T"....

It sounds as if your slo trade system achieves this without all the emotional mumbo jumbo.
 
The October candlestick showed some strength. Still we are very safely under the 20 month moving average. We've been in cash for a full 6 months now. Looking at the chart, we haven't missed out on anything. But pain. And worry.

SPX_2022-11-01_07-34-54.png
 
off topic, but important

make no contributions to the 401k prison that are not matched. instead, use those funds to fund ira. i prefer roth ira

having roth money allows income tax management benefits that increase the value of the pretax money

also, if have roth 401k option and not contributing to roth ira -- best to have a both types of money, pretax and roth in the 401k (for same reason above)
 
Last edited:
I cannot be sick of something I don't remember seeing before dpong, looks interesting but I don't have time now to do it justice, I will come back and read all your posts here. I prethanked most of them. Thank you so much for sharing.

ps I think pmbug might not have understood how depraved us refugees are. Remorse sets in.
 
Ah, I forgot to say the important part out loud. Since we closed October below the 20 month moving average, we shall stay in cash positions at least until the end of November, when we shall consult the chart again.
 
The SP 500 closed November below the 20 month moving average. We remain in cash equivalents in our retirement accounts. We will check the price again at the end of December. So far we have been out of the market for 7 months. Sitting on that pile of cash.

:cool:

SPX_2022-11-30_16-07-44.png
 
Last edited:
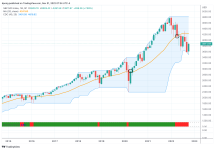
Trading has closed for the month of December 2022. We've been in cash for 8 months. Will next check the 20 month moving average at the close of January 2023.

SPX_2022-12-30_16-19-05.png
 
Back
Top Bottom