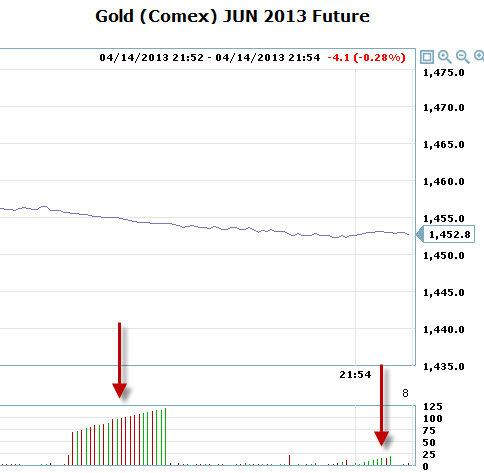
MUST READ: IntraSECOND HFT robot gold manipulation - $ 22 in 1 sec.

Welcome to the Precious Metals Bug Forums

Welcome to the PMBug forums - a watering hole for folks interested in gold, silver, precious metals, sound money, investing, market and economic news, central bank monetary policies, politics and more. You can visit the forum page to see the list of forum nodes (categories/rooms) for topics.

Please have a look around and if you like what you see, please consider registering an account and joining the discussions. When you register an account and log in, you may enjoy additional benefits including no ads, market data/charts, access to trade/barter with the community and much more. Registering an account is free - you have nothing to lose!

swissaustrian

Yellow Jacket
Messages
2,049
Reaction score
0
Points
0
The following article is a MUST READ for anyone who is interested in pms.

Dimitri Speck, gold analyst and author of the German book "Geheime Goldpolitik" (Secret Gold Politcs: http://www.geheime-goldpolitik.de/english/ ), has been exposing intraDAY gold manipulation for over a decade (see here: http://www.pmbug.com/forum/f2/intraday-gold-price-manipulation-10-am-et-269/ ).
Now he was able to proove intraSECOND gold manipulation and the influence of high frequency robots on gold prices

A High Frequency Attack on Gold
By: Dimitri Speck | Thu, Aug 9, 2012

On June 7th, 2012, the price of gold dropped by $22 in less than a second, guided by a computer algorithm during late trading

Sharp price drops in gold, for example $10 within a few minutes, can be observed frequently.
Often they occur several times per week. The decline that happened on June 7, 2012 looks, at first glance, like such a drop as well, although some observers immediately noticed the extremely high speed. Market reports assessed the timeframe from "43 seconds" to "less than 5 minutes". According to spot price data with minute precision, the decrease was $20 in less than 2 minutes. The intraday chart below shows the price development in the spot market on June 7, 2012. The relevant decline is marked in red.

Gold often drops sharply within a few minutes for no obvious reason. It did so on June 7, when the decline during late trading was very fast.

26474_a.png


A High Frequency Attack

However, what took place in the late evening hours of June 7th on the futures market is of a wholly different quality. As part of the CME Group, COMEX is the largest exchange for gold futures contracts. The exchange records each single trade with the exact time, price and quantity. These records are called Times & Sales report and are available from the CME. They reveal for June 7, 2012 for the period of one second, namely at 9:21 PM and 20 seconds CDT, a complex price attack in the high frequency range which can be performed only by especially programmed computers.

During that one second 501 prices were determined, among them 490 with volume, while during all other 3599 seconds of this trading hour on average only 1.87 trades per second were registered. In this once second the number of trades suddenly rose 260-fold! Figure 2 shows an excerpt of the Times & Sales report with the start of the relevant second for the most active August contract.

The future exchange provides Times & Sales reports with all trades. At 21:21 (9:21 PM) there was one trade in each of the seconds 16 - 19. However, in second 20 a total of 501 quotes were registered. The first of which was already pointing downwards.

26474_b.png


Investigation of the Exchange's Records

The left column shows the trade time with a resolution of one second. Next to it, the figure lists the price, the volume and where applicable additional information (such as cancel). During the first seconds, we can see a low trading activity with one trade per second. This is normal for this period late in the evening. Then the high frequency attack started. Please consider that the excerpt below only shows the first seven of a total of 490 trades of the second 21:21:20. Faster than a machine gun, one trade after another is executed in milliseconds or faster. The excerpt shows that the price dropped already $3.7 at the start of the relevant second. The many small trades also demonstrate that the reason for this activity was not just a large misplaced order. But during this one second more oddities occurred. Figure 3 shows another excerpt from the Times & Sales report of the relevant second.

During second 20, a series of sharp drops took place in the range of milliseconds
. The example shows a drop of 8.3, down from 1578.1 to 1569.8.

26474_c.png


Flash Drops within Milliseconds...

The excerpt starts with two trades at $1578 and a small rise to $1578.1. But then the price abruptly drops by $8.3! As quick as a flash, one trade after another is executed at this much lower price of $1569.8 with the volume of only one contract. We notice significantly lower prices appear in the most active contract within milliseconds. Actually one would expect that there were many trades in between due to limited buy orders being in the market. As the price sank, there was no execution all the way down the 83 steps of $0.1 each. But then there were eight trades at once at $1569.8 with a volume of exactly one. It seems as if the trades have been shot under the buy limits of other market participants.

...Followed by Recoveries

However, this low shot is not an isolated case. Sudden drops of at least $7 without a price in between appeared five times in the relevant second. In addition there were several smaller declines. But the prices recovered almost always completely in between! Thus there are apparently some buy orders. This rapid up and down appears as if the other market participants awakened from milliseconds of sleep, then placed their orders, only to fall right back into another millisecond nap. In reality, however, a high frequency computer program was active which generated a large number of individual trades to manipulate the price.

The Attack's Second in Detail

Now we look closely at the second 21:21:20. The figure below shows all the prices in the relevant second, an Intra-Second Chart, so to speak. As is common, the vertical axis indicates the price in dollars per ounce. On the horizontal axis the trades during that second are sequentially numbered. In addition, the prices before and after are shown, and so-called indicative prices (in red).

The almost 500 trades of second 20: Clearly visible are many sharp drops, followed by recoveries. These movements happened in fractions of a second.

26474_d.png


High Frequency Up & Down


We can clearly see the up and down of the prices. Neither a mistrade, nor a move in the spot market, nor a building up of several high frequency programs (like in the flash crash of the stock market on 6 May, 2010) can cause such swings. In addition, the hundredfold increased number of trades and volume can eliminate such causes. Also the spot market can't be the cause in question, as it lagged behind the sharp drop. Instead it was a phenomenon of the futures market. Generally, no person but only a high frequency computer program can act so fast. Due to the lack of any suitable alternative, its purpose must have been price manipulation. Indeed it was achieved: the price stayed more than $20 lower for hours - time enough to get back the costs of the operation.

The Trading System of the Exchange

At this point a look at the trading system of the CME is merited. Due to the conspicuous price movements, the CME halted trading on 7 June 2012 already during second 21:21:20 for 40 seconds by a program called Stop Spike Logic. This also means that the 500 price movements took place in less than a second! While this reaction of the trading system makes sense, other procedures are questionable. For instance so called indicative prices should appear only when no trading takes place (indicative prices are estimates where supply and demand would meet). However, the Times & Sales report shows indicative prices during trading even before the halt (see Figure 4). These prices stood repeatedly at $1556 or about $22 lower than in the second before. At the same time this was already the level at which trading should start again after the halt. The CME was not able or not willing to explain how this could happen despite repeated inquiry and detailed explanations of the facts. For the sake of completeness, it should be noted that at this point there were no news for the gold market and that other markets such as currencies, bonds or stocks showed no significant price movements (except of silver).

Conclusion

High frequency programs which now account for a significant share of trading activity have rightly fallen into disrepute in recent times. They might be useful in some cases such as avoiding market impact while placing large orders. However, unequal access to the market is questionable as are highly technical efforts which are ultimately done only to pull money out of the pockets of slower market participants. At the very latest, limits of legality are touched when high frequency programs are used for front running or to manipulate prices. Such a price manipulation took place on June 7, 2012, at 9:21 PM and 20 seconds in form of a high frequency attack on gold. One second was enough to manipulate the price of gold down by more than one per cent for the duration of several hours. Although in the past central banks repeatedly intervened in the gold market, it is unlikely that this action was done by a central bank. In the field of high frequency trading, the technical complexity and the necessary level of experience and specialization are probably too high. Therefore, a private financial institution must have done the high frequency price manipulation to achieve a trading profit. This was a well-defined incident in thin trading, limited to a short time period and to a single market. These conditions make it ideal for a successful investigation by the regulatory authorities.
http://www.safehaven.com/article/26474/a-high-frequency-attack-on-gold
 
Why anyone would even consider investing into such a system of corruption and manipulation is beyond me. It defies all rationality.

And another thing; this shows just how fragile and precarious the whole financial system is.
 
Free digital money for the computer jockeys with the fastest CPUs/connections. What a joke.
 
Or humans fast enough to buy the dip - they don't always recover in milliseconds, you know. I made a bit off some of the dislocation due to Knight, for example.
Human judgement says - nothing should double or go to half in a couple minutes after the open, and you can trade accordingly if you have enough stuff on watch lists and enough automatic alerts. You just KNOW it's something broken and can take advantage for a few quick bucks.

Not always, but...
Robots have no attention span and don't know the fundamentals, you just play the game on a timescale they ignore, and can do fine despite them. Doesn't hurt to know about the stuff that drives them, though - they're like any other player at the poker table, fast but actually, very stupid - and their tells are the tape itself. Even with mere one second resolution I have here, you can see them in action and work with what you see.

BTW, I don't "invest" in this corrupted system - I trade it. Big difference, I agree about "investing". Things only come back to true fundamentals about 2-3 times in a lifetime, and that requires luck to "catch" - and as much paying attention as trading does, so why not trade instead?
Personally, I think any predicting of the future is at least slightly vain - and that's what an investor implicitly claims to be able to do.
The immediate future is a lot less uncertain than long term, so which is vainer - trading, or investing?
 
I'm on the road, so I can't post a chart today.
Somebody please post a high resolution gold / silver chart of the 9:45 am - 10:45 am timeframe.
Frightening hft action...
 
Nice catch, swissaustrian. This kind of garbage is EXACTLY why physical only is the way to go.

Unless you are like DCFusor and can beat them at their own game! I cannot, so I settle for going to the coin shop every now and then. Since I cannot beat the robots, i'll just keep buying the real thing:

:gold:
 
Today's rocket launch to the upside was clearly robot driven, too.

Look at the charts:

2zqy53s.gif


2vspyjq.gif
 
Headline chasing AI - investing for the future!
 
Headline chasing AI - investing for the future!

Having worked with modeling, this is not suprising. Most likely most commodities models have some form of unemployment as a predictive variable. As soon as this input was changed the model output would change as well.

Knowing that an input to these models will change, causing volatility, on a predictible day actually makes your investment choices easier. If you want to attempt to profit off the expected volatility, you could always try an investing strategy such as a straddle.
http://www.investopedia.com/exam-gu...es/straddle-option-strategy.asp#axzz25n3Ed3VT

:cheers:
 
When the unnatural occurs frequently, does it become natural?
 
Nanex analysis of the Dec. 4th midnight smackdown

Nanex ~ 04-Dec-2012 ~ Midnight Gold Crush
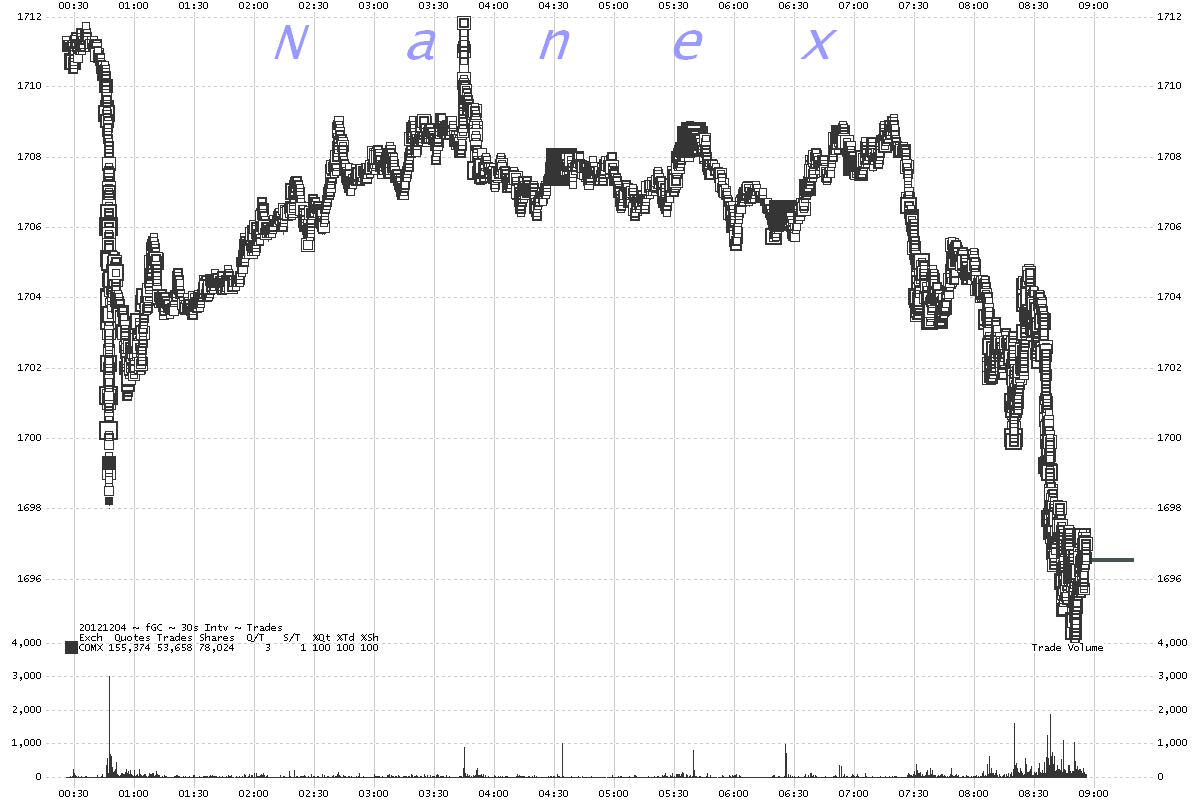
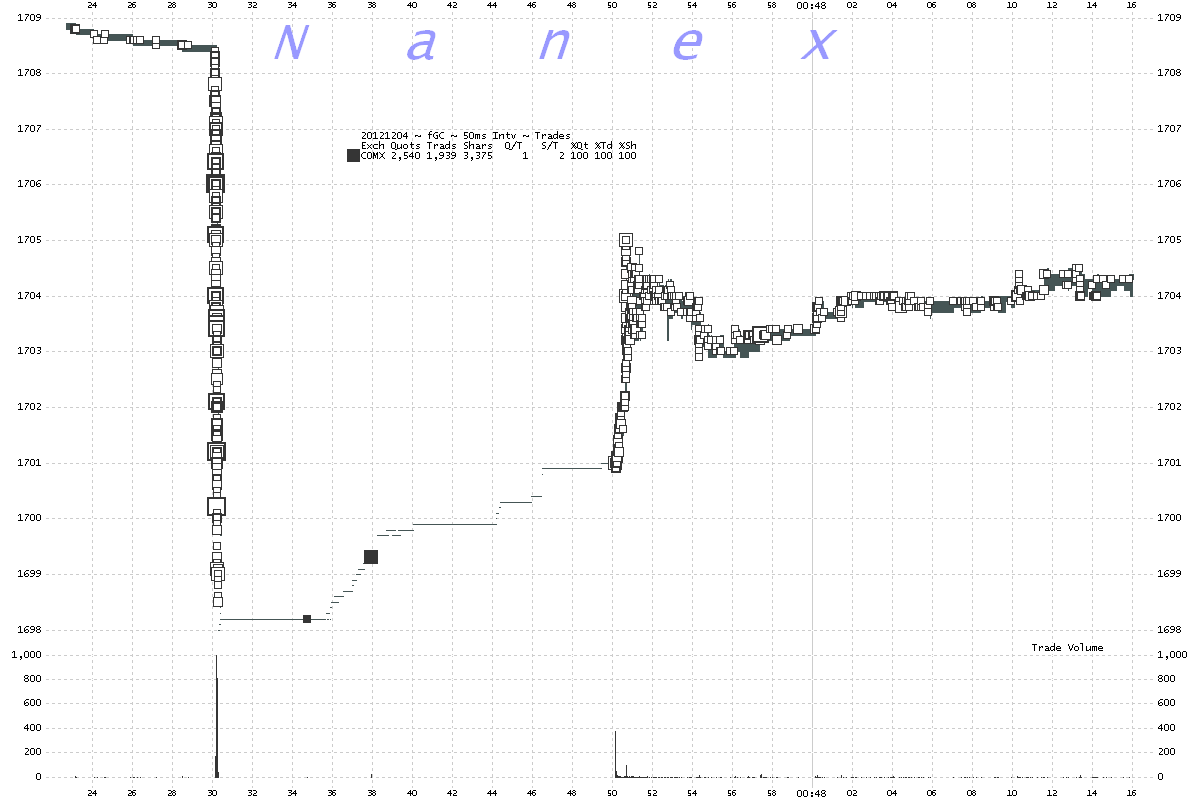
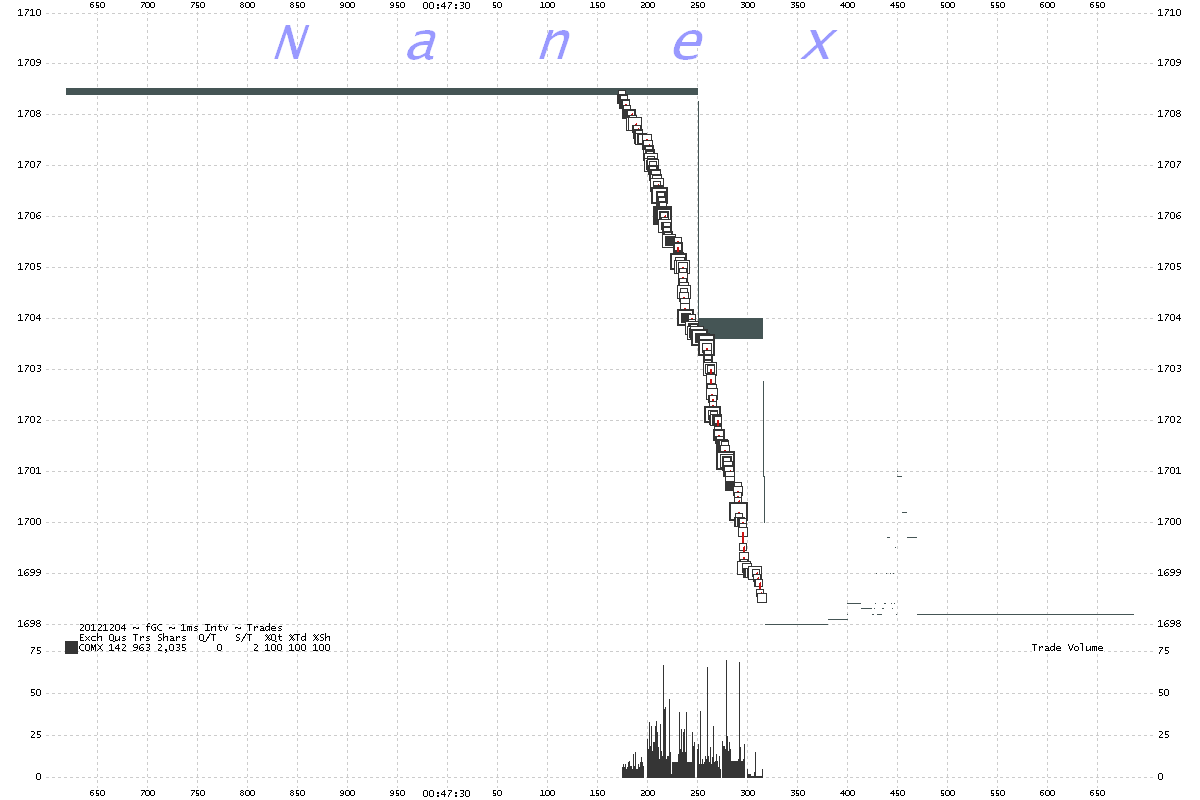
On December 4, 2012, at 47 minutes and 13.1 seconds after midnight, 2,035 February Gold Futures contracts (GC.G13) took the market down $10 as fast as the exchange could execute the order. Later that morning, we saw more of these sudden price moves.


1. 30 Second interval chart showing trades for the first 9 hours of trading in the February 2013 Gold Futures Contract (GC.G13).
The midnight crush in the first drop on the left.

20121204.fGC.G13.00.26.00.000_30000ms.1.gif


Zoom of chart above showing about 45 seconds of time. Thin gray line is quote spread.

20121204.fGC.G13.00.47.22.700_50ms.0.gif


3. Using a 1 millisecond interval to zoom in on one second of time.
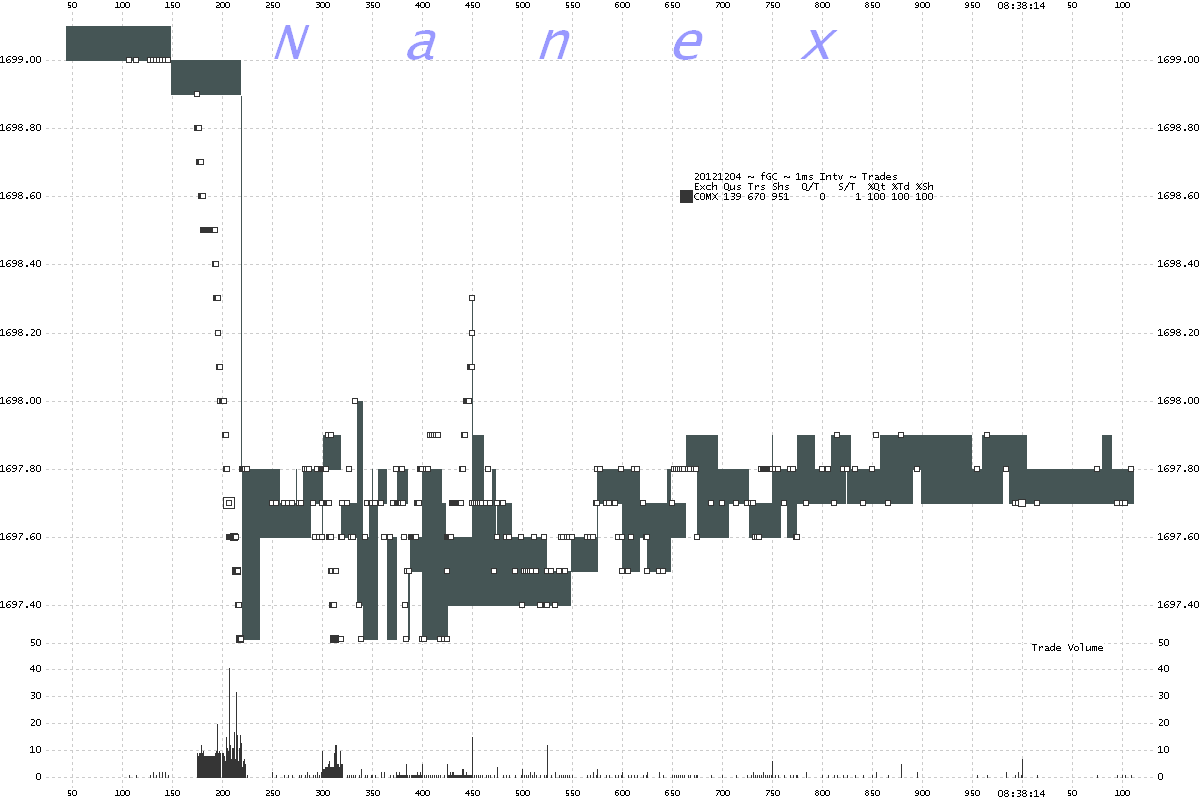
The trades are the squares. The Bid/Offer is the dark gray shading. When trades first execute, then the quote follows, it's because the entire book was swept.

20121204.fGC.G13.00.47.29.619_1ms.0.gif


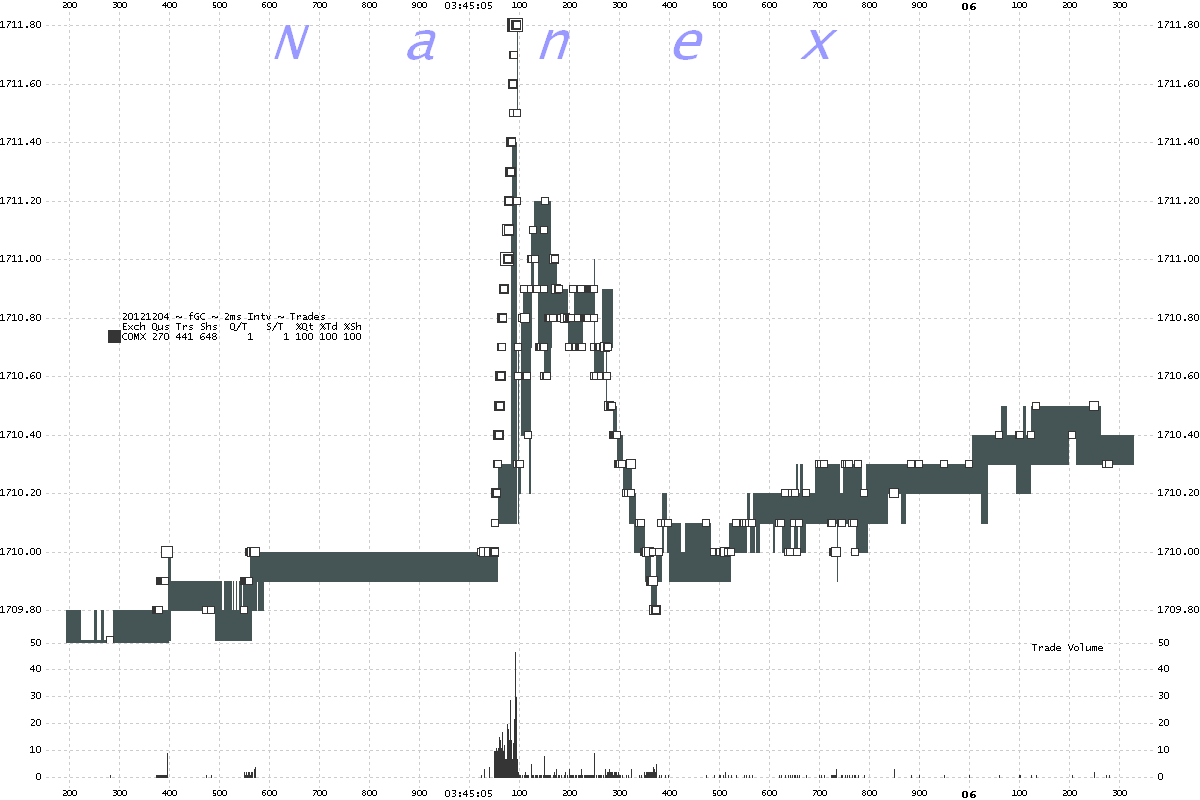
4. Later than morning at 3:45:05 Eastern time, a jolt to the upside.
20121204.fGC.G13.03.45.04.194_2ms.0.gif

http://www.nanex.net/aqck2/4005.html

Post continues below
 
Continuation of the post above:

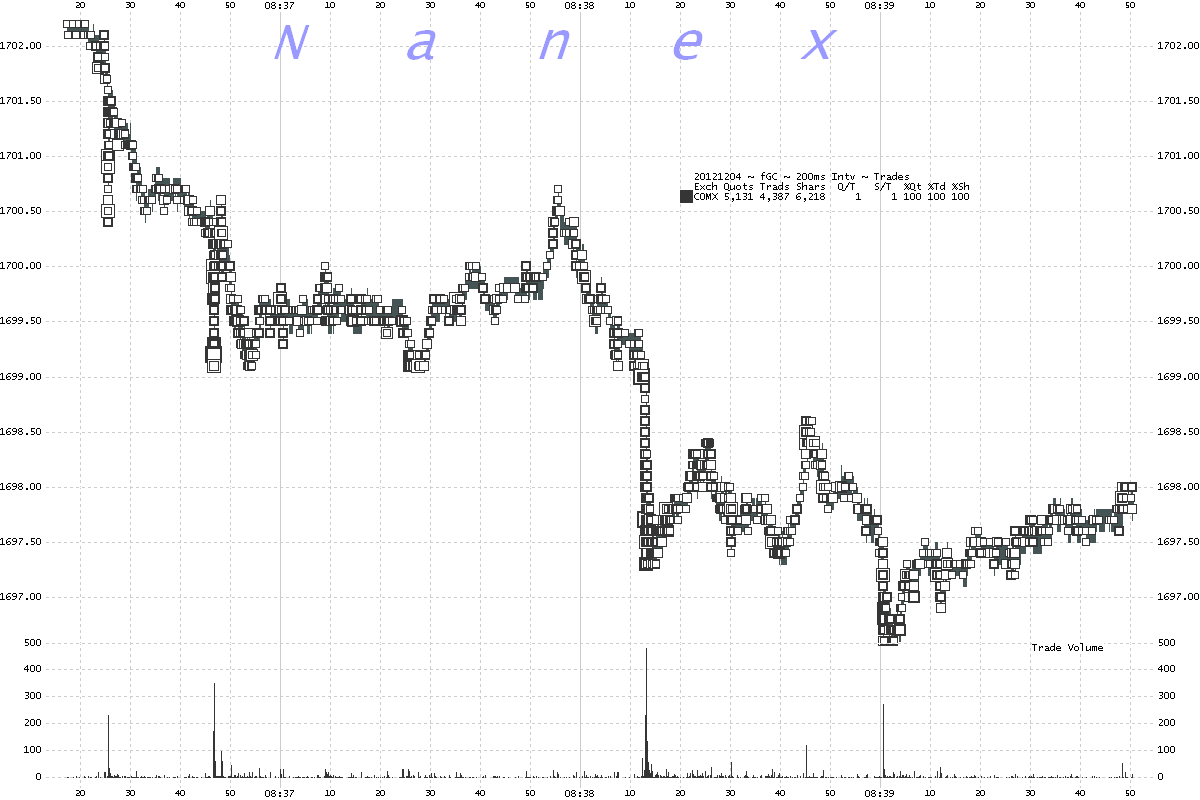
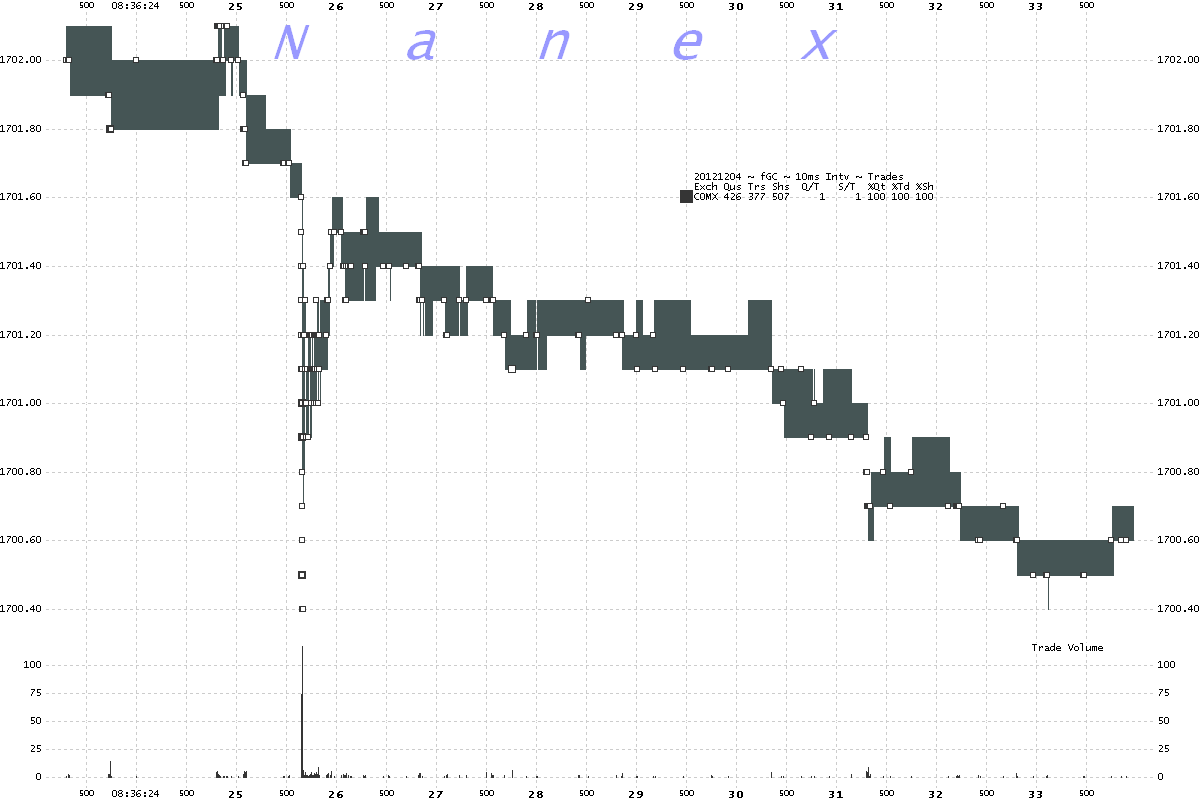
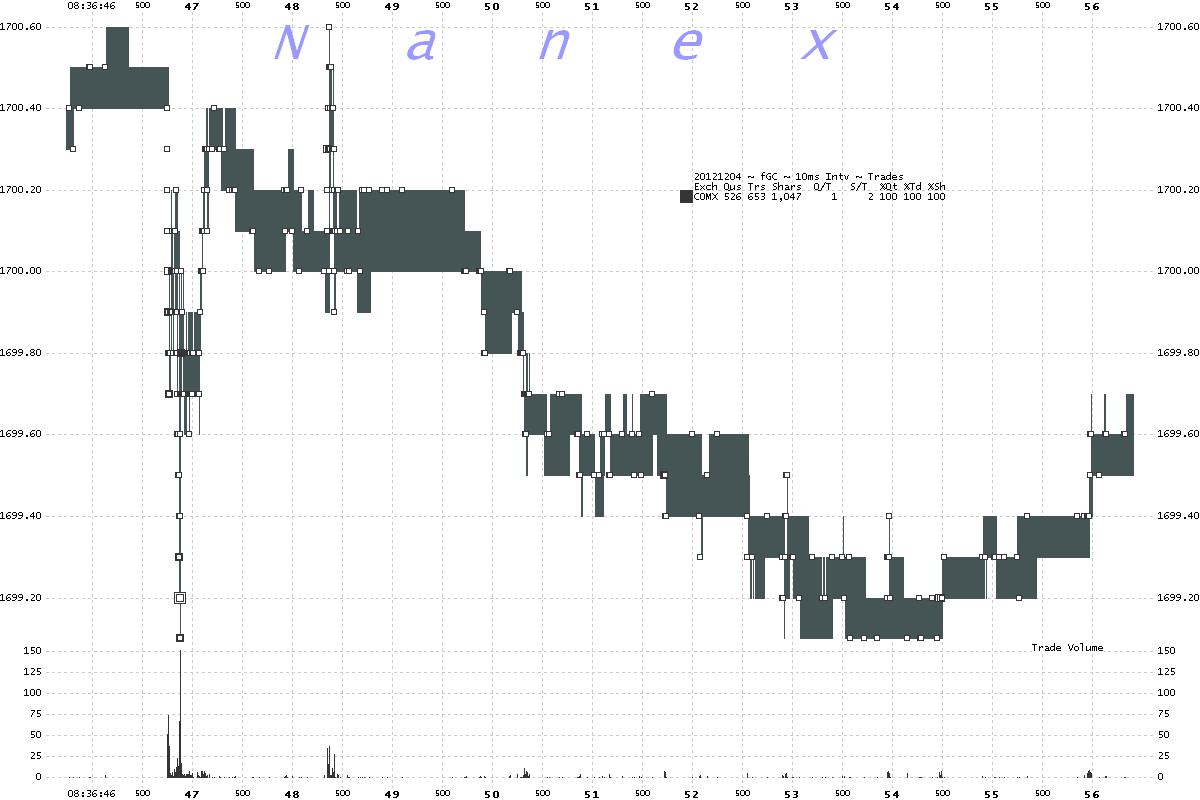
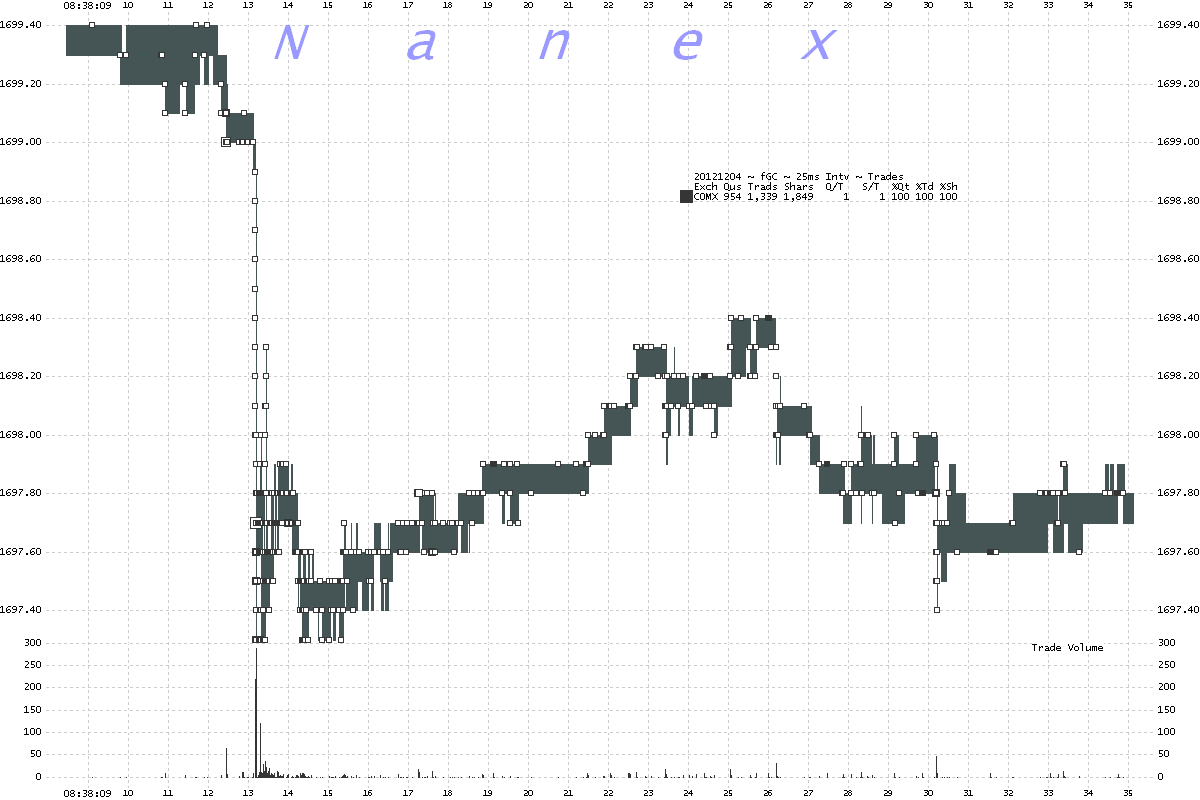
5. Later that morning between 8:36 and 8:40am Eastern, more sudden buying and selling events took place. The chart below is an overview of these events.

20121204.fGC.G13.08.36.17.200_200ms.0.gif


6. Zoom of Chart 5 showing first event.

20121204.fGC.G13.08.36.23.300_10ms.0.gif


7. Zoom of Chart 5 showing second event.

20121204.fGC.G13.08.36.45.740_10ms.0.gif


8. Zoom of Chart 5 showing third event

20121204.fGC.G13.08.38.08.450_25ms.0.gif
http://www.nanex.net/aqck2/4005.html
 
Sell Mortimer, sell! Man, if those guys had had these trading capabilities, they wouldn't have been broke at the end of the Trading Places movie.
 
You see, this is when i want to make the punishment for market manipulation having your fingers smashed with a 20 ounce Estwing framing hammer.......one at a time. Thumbs? Bent over backward until they snap and then smashed like the rest.

Where is the damned CFTC on this????
 
...
Spot gold prices tumbled to a near 30-day low of $1,687 a troy ounce Thursday morning, down $63 per ounce from last week's high of $1,750 per ounce as rumours of a mystery seller unwinding a major hedged position gained currency.

"We're actually seeing a fairly mysterious seller in the Asian time zone over the last week on two occasions," said Jeff Rhodes, CEO of the Dubai-based INTL Commodities.

According to Rhodes, the "mystery seller" times his deals in the "twilight period," or after the London market closes and just before the Asian markets really get going, when the trading is thin. "We've seen some fairly large sell orders hit the market in this twilight zone," he told the Dubai Eye 103.8 radio station.

The large sell orders in a thinly traded market have had "quite an impact," says Rhodes, with gold plunging from $1,750 to just above $1,690. "It's mysterious. I can't explain it," he says. "It's almost as though there is a speculator or speculators who are just trying to trigger a technical move to the downside," Rhodes maintains.
...

http://gata.org/node/12000

:rotflmbo:

"almost"
 
Algo trading at it's best:

8:30 am poor jobs data
9:30 am pre-opening bell spike
10 am good pmi data and London pm gold fixing

10ykzg9.gif
 
I have a question here. OK, motion is money if you're on the right side of it.
So, I suppose the assumption is that these HFT's are short and manipulating the price down to cover at a profit? Something doesn't quite add up for me here. Why go that direction? Since we know PM's in general are tracking the ever increasing CB debt, why not make them pop instead - it should be easier to make something go further in the direction it is already going longer term.

It should be possible at least in some cases to do a little more work - this by itself doesn't look like it makes the HFT's money - they would have to have other positions that benefit from this manipulation - and someone should look to corroborate that.

Else, you'd have to strongly suspect that despite what's reported, this IS the Fed doing it, probably via proxy. I don't know how to do this looking, any takers?

Most HFT are still simple trendfollowing machines, that's first generation hft and it has existed for decades, an early proof beeing the 1987 crash. The incredible speed of the crash was caused by automatic portfolio insurance, ie computers buying vix and selling stocks (simplified). If technical indicators are bad, these primitive HFTs sell. If there is an intraday reversal for whatever reason (short covering, physical buying etc.), the buy. They don't care about fundamentals. The futures fund that I've been managing until early 2011 has used this type of HFT, although we were holding most positions for 1-5 hours. That's not typical HFT behavior.
Second generation HFTs are programmed to interpret news headlines. They're responsible for the regular takedowns at FOMC or non farm payroll releases. They're setting the tone and then first gen HFTs follow their trends, intensifying trends like a self-fulfilling prophecy. As far as I know, second gen. HFT are only programmed to react to standardized news releases, extraordinary political or economical events are not understandable to them. The interpretation of human speech by machines has made massive progress, though. IBM's Watson project is probably just the tip of the iceberg: http://www-03.ibm.com/innovation/us/watson/watson_in_finance.shtml
Then there is a third kind of HFT, the manipulative ones. Some are designed to fight other HFTs by frontrunning them or by reading their trading patterns and forcing them into losses. Others are designed to manipulate prices outright by flooding the market with insane numbers of orders with bids or asks that far away from the current price of an asset. That's the type of HFT that was used for the manipulation in the op of this thread (red dots in the chart):
26474_d.png

I agree that these manipulations might not even be done for profit, at least not for the profitability of a single trade. E.g. before op/ex, it makes sense taking losses if these or offset by larger gains on options underwriting.

---

Now who is behind the manipulation? Monetary authorities or private entities? I don't have any proof, but I don't think such blatant manipulation would go unnoticed by central banks. The fact that nobody is speaking out tells me that it is at least sanctioned by them. The CFTC silver investigation also seems to have found something that the leadership won't publish.
In the end it's probably another incestouous partnership between public and private actors, under which the private actors (JPM and HSBC) are the proxies of public interests. The anecdotal evidence compiled by GATA points to that.
 
Last edited:
Chris Martenson has examined the Sunday night activity:

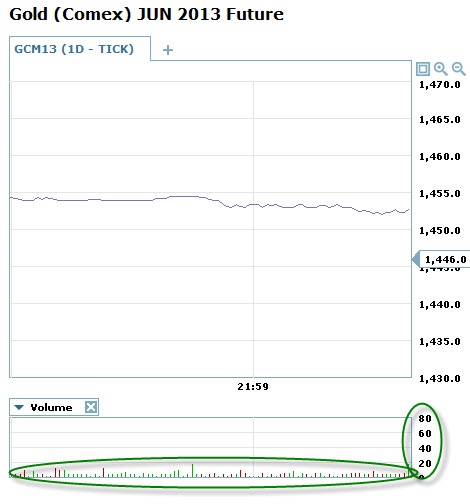
... For a closer-up look at this process, let's turn to Sunday night and with a resolution of about 1 second (the chart above is with 5 minute 'windows,' or candles, as they are called). Here I want you to see that whoever is trading in the thin overnight market and is responsible for setting the prices cannot possibly be human. Humans trade small numbers of contracts and in consistently random amounts.

Here's an example:
Gold_traded_by_humans.jpg


Note that the contracts' numbers, in the single digits to tens, are randomly distributed, and that the scale on the right tops out at 80, although no single second of trades breaks 20.

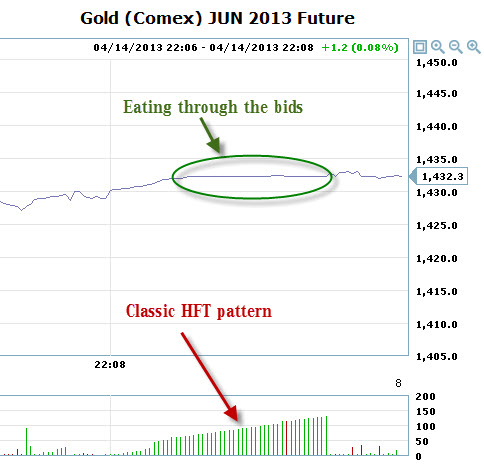
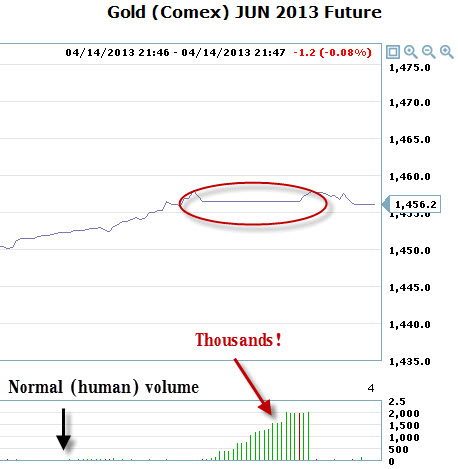
Now here are a few patterns that routinely erupted throughout the drops during Sunday night (yes, I was up very late watching it all):

Gold_Trading_Anomalies_No1.jpg


Gold_Trading_Anomalies_No2.jpg


Gold_Trading_Anomalies_No3.jpg


These are just a few of the dozens of examples I captured over a single hour of trading before I lost interest in capturing any more.

As I was watching this and discussing it with Adam in real time, I knew that I was watching the sort of HFT/computer-trading robots that we've discussed here so much in the past. They are perfectly designed to chew through bid structures, and that's what you see above. They are 'digesting' all the orders that were still on the books for gold, to remove them so that lower and lower stops could be run.

Anybody who had orders up against these machines, perhaps with stops in place, or perhaps even while sleeping because this all happened in the hours around midnight EST, lost and lost big.

There is really no chance to stand against players this large with a determination to drive prices lower. At the very least, I take the above evidence of computer-assisted declines of this magnitude to be a sign that our "markets" are completely broken and quite vulnerable to a crash. That the authorities did not step in to halt these markets during such a volatile decline, when they have repeatedly stepped into other markets and individual equity shares on lesser declines, tells me much about the level of official support for such a decline.

It also tells me that things are speeding up, and the next decline in the equity or bond markets may happen a lot faster than anybody is expecting.

...
http://www.peakprosperity.com/blog/81535/gold-slam-massive-wealth-transfer-our-pockets-banks
 
Gold just gapped 10+$ higher in a second. It's just ridiculous. Silver jumped 30 cents.
 
Last edited:
Just finished reading Chris Martenson's article referenced above. Good and thought provoking stuff. Definitely worth a click.
 
Notice the little hop straight up immediately before the release? That's their buddies getting a little something-something before anyone else.
 
I wouldn't rule out the CB's here - motive is high. Just because we know the government is pretty dumb, that doesn't cover all cases or allow that assumption to be made a priori.

For example, they've been known to contract a lot of things out to smart guys...I seem to recall one they are after now for not following their program the way they wanted...

For all we know now, Tom Clancy's "Teeth of the Tiger" is the reality. After all, he wrote the script for 9/11, and it seems people out there can read. In the above mentioned book, "an agency" used their superior data collection capability for trading themselves...now, who do we know that has that ability right now, for sure and certain?
 
Back
Top Bottom