Negative lease rates for gold (and silver)

Welcome to the Precious Metals Bug Forums

Welcome to the PMBug forums - a watering hole for folks interested in gold, silver, precious metals, sound money, investing, market and economic news, central bank monetary policies, politics and more. You can visit the forum page to see the list of forum nodes (categories/rooms) for topics.

Please have a look around and if you like what you see, please consider registering an account and joining the discussions. When you register an account and log in, you may enjoy additional benefits including no ads, market data/charts, access to trade/barter with the community and much more. Registering an account is free - you have nothing to lose!

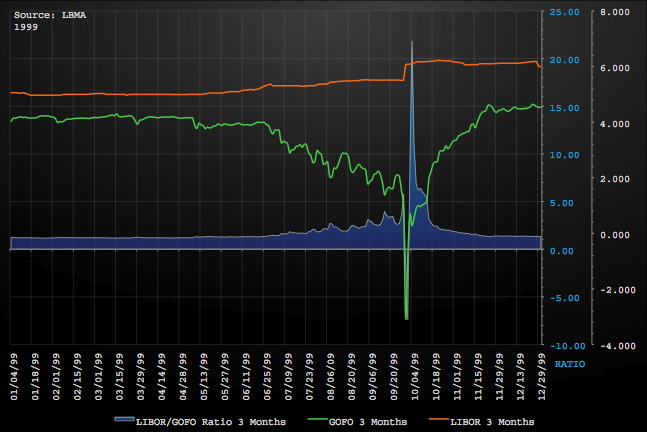
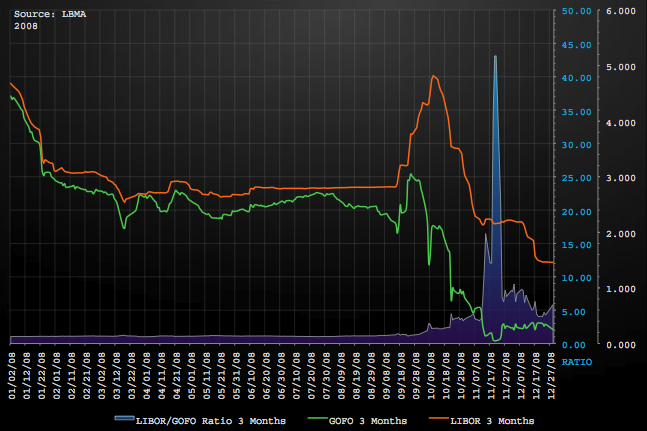
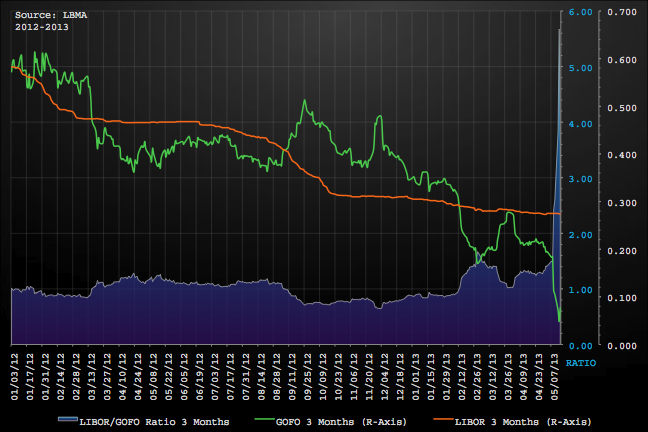
Somebody (unknown to me) has posted these three Charts (here: http://justpaste.it/2n00 ) showing the gold forward rates (GOFOs, the premium for future delivery over spot) of 1999, 2008 and 2013. He also calculated the lease rates, ie the profitability of selling spot, purchasing gold back in 3 months and investing the funds from the sale of spot in 3m Libor. That's called the gold carry trade. It's especially profitable when forward rates are very low or even negative.

1999 and 2008 were the last times when GOFO was so dislocated compared to LIBOR, ie lease rates were rapidly rising.
In 1999, it signalled the coming dotcom bust and the effects Washington Agreement (which limited gold sales by central banks). In 2008, it heralded Lehman and the stock market crash.
Both times GOFO and the derived lease rate were the canary in the coalmine and marked cyclical lows in spot prices.

Now the physical market is dislocated again. What's the coming bust in financial markets this time? A global bond bust?

vbzquc.png


muejt9.png


pyl2ti.png
 
I am going to guess that the next bust will be real estate (again) with interest on the 10 year ticking up, that's going to be a problem for mortgage rates. A big problem. Then stocks go down (again) and then Obamacare kicks in, and it doesn't work very well, and the Feds find out we can't afford to pay for it, and it causes consumers even more heartburn, and so the FED has to do more. Rinse and repeat. That's just my hunch. Would love to be wrong.
 
Last edited:
The comment out of Japan tonight (YEN has weakened enough) means they're worried about a spike in their bond yields already. This could easily spill over into other countries.
 
The comment out of Japan tonight (YEN has weakened enough) means they're worried about a spike in their bond yields already. This could easily spill over into other countries.

An awful lot of people are anticipating a Japanese financial crash and capital flight from all the devaluation. I agree the spillover could be messy. China can't be happy about this.
 
I reckon it will happen much more quickly this time.
Theres a greater awareness that something isnt right and that markets are being artificially managed.
The music is playing loudly, everyone is dancing but the smile is false and everyone is now waiting for the first hint of warning ......
 
GOFO seems to have stabilized somewhat over the last few days:

16-May-13 0.04833 0.06833 0.08000 0.12333 0.18833
17-May-13 0.04833 0.06500 0.07833 0.12167 0.18500
20-May-13 0.05000 0.07167 0.08500 0.12667 0.18333
21-May-13 0.06500 0.08167 0.09500 0.13167 0.18833
22-May-13 0.04833 0.06000 0.07500 0.08833 0.13000
23-May-13 0.04833 0.06667 0.08500 0.13000 0.18833

Yesterday's blip in the 6m and 1y rate is weird. These are both all time record lows for the two durations. It's almost as if somebody (from the official sector) forgot to offer deals in the 6m and 1y range yesterday...
 
22-May-13 0.01667 0.06000 0.07500 0.08833 0.13000
23-May-13 0.04833 0.06667 0.08500 0.13000 0.18833
24-May-13 0.04833 0.06000 0.07667 0.12333 0.18667
28-May-13 0.03000 0.04200 0.06600 0.12200 0.18600
29-May-13 0.01667 0.03333 0.05500 0.11000 0.19667

Two remarks:

1. They changed the May 22nd data for the 1m rates retroactively :doodoo: (see the post above) That puts a big questionmark behind the data in general :paperbag:

2. 1m rates are about to go negative again. Western central banks are probably pretty busy right now...
 
Good catch sa. Makes the numbers for the 21st and 23rd even more interesting. That's a lot of volatility.
 
Looks like someone found a lot of gold...

29-May-13 0.01667 0.03333 0.05500 0.11000 0.19667
30-May-13 0.02500 0.04500 0.06333 0.11500 0.18500
31-May-13 0.07333 0.08833 0.10667 0.14500 0.20167
 
The sudden rise in rates probably comes due to the end of the month and futures expiration. June is traditionally a major delivery month for futures. Somebody probably had to buy a lot of physical to deliver before June futures expired last week. Now that this is over with, the tightness of the market might be a little less urgent for a while. We'll see. Summer is usually a weak season for pm demand.
 
Looks like someone found a lot of gold...

29-May-13 0.01667 0.03333 0.05500 0.11000 0.19667
30-May-13 0.02500 0.04500 0.06333 0.11500 0.18500
31-May-13 0.07333 0.08833 0.10667 0.14500 0.20167

After peaking* on June 18 (*since the quoted post):

18-Jun-13 0.17000 0.18000 0.19500 0.22250 0.25750

the rates have started falling again...

26-Jun-13 0.08167 0.08833 0.09667 0.14167 0.23333
27-Jun-13 0.07333 0.08000 0.09333 0.13667 0.23167
28-Jun-13 0.07000 0.07800 0.09000 0.12800 0.22000
 
This time rates don't rise at the beginning of the month. The next few days are going to be interesting. There is a possibility for backwardation to return for the first time since 2008:

27-Jun-13 0.07333 0.08000 0.09333 0.13667 0.23167
28-Jun-13 0.07000 0.07800 0.09000 0.12800 0.22000
01-Jul-13 0.07833 0.08667 0.09167 0.13167 0.23500
02-Jul-13 0.07167 0.07667 0.08667 0.12833 0.23333
03-Jul-13 0.05667 0.06833 0.08167 0.13000 0.23333
04-Jul-13 0.03500 0.05167 0.06167 0.11500 0.23167
05-Jul-13 0.01500 0.03167 0.05167 0.09667 0.21833
 
08-Jul-13 -0.06500 -0.04333 -0.03000 0.03500 0.18167

We got negative forward rates today for the first time since 2008 (Lehman), ie BACKWARDATION :popcorn:

3 month rates are negative for the first time ever


6 month rates are also at all-time lows
 
Remain-Calm.gif


Perhaps a sign that the bottom is in? We'll see how much blood the streets can hold I guess.
 
Backwardation day no. 2


08-Jul-13 -0.06500 -0.04333 -0.03000 0.03500 0.18167
09-Jul-13 -0.10600 -0.08400 -0.07000 -0.01000 0.13800


6 months rates negative too...
 
Perhaps a sign that the bottom is in? We'll see how much blood the streets can hold I guess.

It's a clear sign of stress in the physical market. One would assume that the market should turn, but we've seen strange things this year.

Rates fell even more today, so an official sector intervention is probably on the way via central bank leasing.

Nobody except a few insiders really knows what's going on, but everytime GOFO has gone negative, something big and ugly was up, as I posted here:
http://www.pmbug.com/forum/f2/negative-lease-rates-gold-silver-341/index7.html#post21888
 
Yes that was a great post you linked to, also this one you wrote...


22-May-13 0.01667 0.06000 0.07500 0.08833 0.13000
23-May-13 0.04833 0.06667 0.08500 0.13000 0.18833
24-May-13 0.04833 0.06000 0.07667 0.12333 0.18667
28-May-13 0.03000 0.04200 0.06600 0.12200 0.18600
29-May-13 0.01667 0.03333 0.05500 0.11000 0.19667

Two remarks:

1. They changed the May 22nd data for the 1m rates retroactively :doodoo: (see the post above) That puts a big questionmark behind the data in general :paperbag:

2. 1m rates are about to go negative again. Western central banks are probably pretty busy right now...

This made me think that they have already been intervening to keep gold from going into backwardation via central bank leasing and maybe even manipulating the rates, so the fact that it's finally dived into backwardation makes me think the intervention has already happened and failed?
 
This made me think that they have already been intervening to keep gold from going into backwardation via central bank leasing and maybe even manipulating the rates, so the fact that it's finally dived into backwardation makes me think the intervention has already happened and failed?
If that's true, ie central banks being unable to supply the market via leasing, then demand has to be in the thousands of tons per month. If the official figures of central bank holdings are even closely true, the NY FED and the BOE should have ample gold holdings available for leasing (incl. third party holdings like Germany's gold). Rumors are that these holdings are all leased out already, though. That would mean that we're wittnessing the big one, ie the collapse of the bullion banking system. I don't hold my breath to be honest. :noevil: These negative rates should diminish in a matter of days. If they don't, we can start taking preparations for the big one.
 
Did Germany get their gold yet? /evil laugh
 
For comparative purposes, these are the rates from September/October 1999. The announcement of the Washington Agreement ( http://en.wikipedia.org/wiki/Washington_Agreement_on_Gold ) was on September 26 th (a sunday). It clearly caused a panic amoung the shorts. But it took only 2 weeks until rates had normalized, probably because central banks stepped in and offered fresh supplies via leasing.

24-Sep-99 1.9600 2.0000 2.0400 2.1100 2.6300
27-Sep-99 1.5300 1.5300 1.5400 1.4100 1.5700
28-Sep-99 0.8700 0.9100 0.9500 1.0500 1.1800
29-Sep-99 -4.5300 -3.7800 -3.0600 -1.2300 -0.5300
30-Sep-99 -1.1300 -1.1100 -0.8200 0.0100 0.3500
01-Oct-99 0.3900 0.5400 0.6600 0.7800 1.0600

...

Solidly postitive rates 2 weeks later, but short term rates higher than longer durations, ie an inverted yield curve

14-Oct-99 2.4500 2.2800 1.9600 1.9200 1.9600

Another two weeks later, the curve became flat
01-Nov-99 4.3400 3.3400 3.3400 3.3400 3.3100

But by the end of the year, it was inverted again
30-Dec-99 5.0400 4.8400 4.5400 4.4300 4.3800

This happened to prices:

ausep99.gif


auoct99.gif


In the following months, the magic barrier of 300 was tested over and over again, it took until April of 2002 to finally leave it behind.

------

Moving over to 2008:
During the depth of the crash, gofos went negative for three days again:
10-Nov-08 0.54167 0.55000 0.65000 1.10000 1.43750
11-Nov-08 0.50000 0.54286 0.59286 1.00571 1.33429
12-Nov-08 0.12500 0.23333 0.33333 0.80667 1.12500
13-Nov-08 0.07667 0.14286 0.20000 0.71429 1.08000
14-Nov-08 0.02857 0.08200 0.13571 0.73333 1.08667
17-Nov-08 0.04500 0.13333 0.18571 0.75714 1.11857
18-Nov-08 0.03400 0.12000 0.18333 0.72143 1.01571
19-Nov-08 0.08286 0.01571 0.06333 0.51429 0.90000
20-Nov-08 -0.08000 -0.04500 0.05000 0.46333 0.89167
21-Nov-08 -0.11667 -0.07429 0.05000 0.44000 0.86857
24-Nov-08 -0.03667 0.03857 0.10143 0.47000 0.93000
25-Nov-08 0.24000 0.26667 0.31667 0.55000 1.00286

Note that the curve did not invert in 2008.

Price action:

aunov08.gif


audec08.gif


-----------

What we can learn:

1. Prices should rise in the short term.
2. Negative rates should not stay for more than another day.
3. Something huge is happening behind the scenes.
 
...
1. Prices should rise in the short term.
2. Negative rates should not stay for more than another day.
3. Something huge is happening behind the scenes.

Like history ever repeats itself. /CNBC experts
 
08-Jul-13 -0.06500 -0.04333 -0.03000 0.03500 0.18167
09-Jul-13 -0.10600 -0.08400 -0.07000 -0.01000 0.13800
10-Jul-13 -0.11167 -0.08000 -0.05833 -0.00167 0.14000

& so it continues...

(Except for the 1 month rates, the other rates have improved slightly, so maybe they're getting control of the situation & as SA suggests this might be the last day of backwardation.)
 
...
The gold market continues to digest the ramifications of gold borrowing costs surging to the highest since the post-Lehman Brothers scramble for gold bullion.

Gold Forward Offered Rates (GOFO) or the cost to borrow gold remains negative and overnight the 1 month GOFO has gone from -0.106% to -0.11167%. Other durations eased marginally.

The lack of liquidity in the the interbank London Good Delivery gold market (400 ounce gold bars) has pushed gold forward rates, known as “gofo”, into negative territory, meaning that gold for future delivery is trading at a discount to physical market prices – a rare situation that has occurred only after the Lehman Brothers collapse and near the bottom of the gold market in 1999.

The last time forwards were negative was in November 2008, when a scramble for physical gold led a sharp price rally of 46% from $682/oz to over $1,000/oz between October 2008 and February 2009.
...
The increase in gold borrowing costs is likely due to a lack of supply of large 400 ounce bars as mints, refineries and jewellers internationally and especially in Asia are scrambling to secure supply.

Last quarter’s record slump is leading to continued physical demand especially in Asia. China in particular continues to see record demand and premiums on the Shanghai Gold Exchange are now at $24 over spot (see table above).

The feverish buying has left many of Hong Kong’s banks, jewellers and even its gold exchange without enough yellow metal to meet demand according to the FT.

In mainland China, the Shanghai Gold Exchange saw record volumes on Monday, while queues formed outside some jewellery shops in Beijing.

China’s net gold imports from Hong Kong increased from 80 tonnes in April to 108.8 tonnes in May or a 35% increase and May was the second highest total on record.

China is set to become the world’s No. 1 gold buyer this year – and it may be already. So far net imports through Hong Kong for the first five months of the year have totalled over 413 tonnes – double those of a year earlier when China imported just over 830 tonnes in the full year.
...

http://www.goldcore.com/goldcore_bl...-hong-kong-jewellers-and-banks-face-supply-is
 
11-Jul-13 -0.05167 -0.02833 -0.01500 0.04667 0.15833

Gold still in backwardation, but rates are easing up, not getting worse.
 
Backwardation day no. 5!!

12-Jul-13 -0.04167 -0.02333 -0.01333 0.06167 0.17000

Any thoughts SwissAustrian? Do you think it's the big one?

I noticed Comex had a big delivery last night, 50k ounces, but no withdrawals, so no clues there.
 
Backwardation day no. 5!!

12-Jul-13 -0.04167 -0.02333 -0.01333 0.06167 0.17000

Any thoughts SwissAustrian? Do you think it's the big one?

I noticed Comex had a big delivery last night, 50k ounces, but no withdrawals, so no clues there.

I'm not convinced yet. Rates are slowly grinding higher. I looks like 3 month rates will be postitive on Monday, maybe 2 months, too.
I'm looking forward to the COT report tonight to see how the backwardation affected futures postioning.
 
Gold still in backwardation and the numbers have gotten worse since Friday not better!

15-Jul-13 -0.05500 -0.04000 -0.02333 0.06167 0.18500
 
Gold still in backwardation and the numbers have gotten worse since Friday not better!

15-Jul-13 -0.05500 -0.04000 -0.02333 0.06167 0.18500

Yes that's interesting. The 1y rates rose a little while the short dated rates fell a tiny bit. I still think we need more signs of systemic issues within the bullion banking system. It might last until the COMEX warehouses are empty and GLD has no inventory, ie 12-18 months from now if the inventory drainage continues at the same speed it has since January.
 
Might last 12-18 months? Boo :(

I was hoping it was more exciting than that!
I know I should be careful what I wish for, but the comex gold drain has been happening since January as you said. The GLD still has a large inventory. I was hoping gold going into backwardation and lasting more than three days meant something was more IMMINENT - like Deutsche Bank with it's 60-1 leverage was about to kick the bucket. Oh well, guess it could be a long movie :popcorn:
 
Maybe it means something imminent. Nobody on the outside of the major bullion banks really knows...
 
... It might last until the COMEX warehouses are empty and GLD has no inventory, ...

If redemptions in SGE continue as they are, COMEX & GLD might not last that long. I have to think that someone is likely pulling inventory from COMEX / GLD to sell on SGE since there is a mark up in premiums.
 
08-Jul-13 -0.06500 -0.04333 -0.03000 0.03500 0.18167
09-Jul-13 -0.10600 -0.08400 -0.07000 -0.01000 0.13800
10-Jul-13 -0.11167 -0.08000 -0.05833 -0.00167 0.14000
11-Jul-13 -0.05167 -0.02833 -0.01500 0.04667 0.15833
12-Jul-13 -0.04167 -0.02333 -0.01333 0.06167 0.17000
15-Jul-13 -0.05500 -0.04000 -0.02333 0.06167 0.18500
16-Jul-13 -0.05667 -0.04333 -0.02500 0.06333 0.18833

Gold still in backwardation.
 
Interesting. 3 months and less is getting worse. 6 months and out is easing up. Something supposed to happen around year end that changes metal availability?
 
05-Jul-13 0.01500 0.03167 0.05167 0.09667 0.21833
08-Jul-13 -0.06500 -0.04333 -0.03000 0.03500 0.18167
09-Jul-13 -0.10600 -0.08400 -0.07000 -0.01000 0.13800
10-Jul-13 -0.11167 -0.08000 -0.05833 -0.00167 0.14000
11-Jul-13 -0.05167 -0.02833 -0.01500 0.04667 0.15833
12-Jul-13 -0.04167 -0.02333 -0.01333 0.06167 0.17000
15-Jul-13 -0.05500 -0.04000 -0.02333 0.06167 0.18500
16-Jul-13 -0.05667 -0.04333 -0.02500 0.06333 0.18833
17-Jul-13 -0.06500 -0.04667 -0.03000 0.05833 0.17667

Rates have been getting steadily worse this week, so the problem definitely isn't getting better.

Yeah I don't know why the longer rates aren't worse, maybe they think demand is only tight in the short term because now that India 'seems' to have curbed imports they think demand will start to ease up?
 
Interesting. 3 months and less is getting worse. 6 months and out is easing up. Something supposed to happen around year end that changes metal availability?

Nothing I know of. Usually September to December are seasonally strong months for gold:

The chart is for 1974-2007

GOLD.GIF
 
...
11-Jul-13 -0.05167 -0.02833 -0.01500 0.04667 0.15833
12-Jul-13 -0.04167 -0.02333 -0.01333 0.06167 0.17000
15-Jul-13 -0.05500 -0.04000 -0.02333 0.06167 0.18500
16-Jul-13 -0.05667 -0.04333 -0.02500 0.06333 0.18833
17-Jul-13 -0.06500 -0.04667 -0.03000 0.05833 0.17667

Rates have been getting steadily worse this week, so the problem definitely isn't getting better.

Yeah I don't know why the longer rates aren't worse, ...

Well, looks like 6mos+ has reversed course with this latest report.

... maybe they think demand is only tight in the short term because now that India 'seems' to have curbed imports they think demand will start to ease up?

I suppose it might be related to an expectation of demand easing after India's wedding season.
 
Back
Top Bottom