
Silver chart

Welcome to the Precious Metals Bug Forums

Welcome to the PMBug forums - a community supported watering hole for folks interested in gold, silver, precious metals, sound money, investing, market and economic news, central bank monetary policies, politics and more.

Register a free account to join the discussions. When you register an account and log in, you may enjoy additional benefits including access to market data/charts and additional members only rooms (including one for trade/barter with the community).

ancona

Praying Mantis
Messages
3,341
Reaction score
36
Points
0
Location
Waaay south
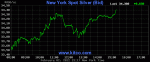
I took a screenshot [I think] of the silver chart today, and wanted to comment on what looks like someone dumping paper. Look at teh big "V" in the middle. It gives me the impression that someone is gearing up for something. I have seen this exact formation many times in January, and wonder if any of you chartists out there can tell me what you think.
 

Attachments

  • Silver Screenshot.gif
    Silver Screenshot.gif
    9.7 KB · Views: 4
It's normal.. you had a move, a retracement and a resumption of the up move. There isn't much you can really take from a chart like that. It's too short of a time frame to have THAT much meaning.
 
As a daytrader (sometimes) when I see a dip like that, it's time to buy and then sell on the next peak. Lots of times with real fine time resolution you'll see oscillations around an uptrend all day long - after you see the first couple you know what you've got, and can play it with reasonable confidence.

It's easier if the frequency is such that there are 4-5 a day, so you can wait till the first couple of them prove out the pattern.

But Derek is right - you can get lots more out of longer term charts than the shorties. It's as though there are a few frequency components, which one might assign to HFT, daytraders, swing traders, position traders, and long term investors in increasing reaction times. Even as a day trader - you do best when all the cycles are in phase, making the current swing the fastest and strongest. It's the same idea as a fundamental and all the odd harmonics (all sines by themselves) adding up into a square wave.

In this case, and making some assumptions that things are fractal (self similar on various time scales) I'd have bought the second dip after it turned up again. It was a higher low, and the context is good on a ten day chart. But silver isn't what I'm playing right now, so I missed this last nice run-up.
 
Last edited:
It's normal.. you had a move, a retracement and a resumption of the up move. There isn't much you can really take from a chart like that. It's too short of a time frame to have THAT much meaning.

Understood........but when it happens avery couple of days, it seems like it is either a scheduled thing or at least some kind of a trend or something.

Perhaps I just want to see it as something, rather than write it off as insignificant.
 
Back
Top Bottom