UK Silver Flow (2021-July 2026)

Welcome to the Precious Metals Bug Forums

Welcome to the PMBug forums - a community supported watering hole for folks interested in gold, silver, precious metals, sound money, investing, market and economic news, central bank monetary policies, politics and more.

Register a free account to join the discussions. When you register an account and log in, you may enjoy additional benefits including access to market data/charts and additional members only rooms (including one for trade/barter with the community).

pmbug

Your Host
Administrator
Benefactor
Messages
21,848
Reaction score
9,253
Points
268
Location
Texas
United-States
I got the idea to make a video visualizing the global silver flows from the perspective of the UK (LBMA). I put in about 4 days of work composing the 67 monthly background slides and started to create a video only to realize that my original background slides (which used a map of the world) was too hard to read when compiled into a video and just didn't work. I had to start over. The final result ended up taking a lot more time and effort than I had anticipated, but I think it turned out well:


It gets a bit hectic after late 2024 and you might need to pause the video in places to fully absorb everything that was happening.

Alas, I didn't have an unlimited budget for making this or I would have also incorporated some temperature gauges for LBMA vaulted ETF/ETP silver and/or LBMA silver vault stock free float totals for the complete picture.
 
Interesting little video. The date in red was hard to find for awhile. Also, might I suggest you add say an End or Start of Month price under the date?

What the heck is in Canada that has been so consistently importing Silver?
 
So it appears to be that the Demand from the US and Canada is all Bank rigging physical demand. When you put the red alert on there in early 2025 is really when Silver started on its run.... The central price riggers (ie the Dinosaurs) had to let the price run to bring in some real silver. It was all Gone (IMO).
 
Interesting little video. The date in red was hard to find for awhile. Also, might I suggest you add say an End or Start of Month price under the date?

It's getting difficult to find real estate to pack everything in. It would be awesome to add a screenshot of the bullionvault price graph, but it would take up too much room at a resolution that actually let you read it.

What the heck is in Canada that has been so consistently importing Silver?

I had wondered that too as I was processing the monthly data over and over. A couple of thoughts on that:
  • PSLV/CEF demand - I give this a low probability. PSLV doesn't change that frequently.
  • Royal Canadian Mint - Needing metal for Maples and such. Would be interesting to cross reference mintages for the corresponding months/years if the data is available.
  • Mint (RCM or private) recasting silver into kilo bars for China or other markets. Canada could have been a middleman and not a final destination. Video only considered UK import/export data.

... When you put the red alert on there in early 2025 is really when Silver started on its run....

That was the tariff risk mitigation that drained the LBMA's silver ocean. We almost saw a repeat at the end of January/early February IMO, but the price got monkey hammered and that freed up ETF vault stock.
 
I had originally planned to put the actual numbers for the net import/export, but that was way too much work. The silver bars represent a range from 0.1 to 100 metric tons.

I posted a chart in the Silver Markets Reports (supporters) forum room a while back:

View attachment 21387

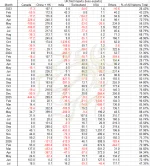
Here's a screenshot of the 2023-Jul 2026 numbers from my spreadsheet:

uk silver flow 2023-jul 2026.webp

The "% of all nations" was the percent of the total for the sum of Canada, China, India, Switzerland & USA.
 
Back
Top Bottom