Rgold

Welcome to the Precious Metals Bug Forums

Welcome to the PMBug forums - a watering hole for folks interested in gold, silver, precious metals, sound money, investing, market and economic news, central bank monetary policies, politics and more. You can visit the forum page to see the list of forum nodes (categories/rooms) for topics.

Please have a look around and if you like what you see, please consider registering an account and joining the discussions. When you register an account and log in, you may enjoy additional benefits including no ads, market data/charts, access to trade/barter with the community and much more. Registering an account is free - you have nothing to lose!

pmbug

Your Host
Administrator
Benefactor
Messages
13,951
Reaction score
4,365
Points
268
Location
Texas
United-States
Dave in Denver:
...
Here's a "technical" chart that you won't find in Gartman's letter but I will give it to you for free. Unfortunately Eric Hommelberg does not freely publish his work anymore but he follows a metric known as Rgold. This is the spot price of gold divided by the 200 dma of gold. The chart I have only shows 2004-2008, but you'll note that whenever the Rgold metric goes above 1.20 it is a definitive "sell" signal AND whenever it goes below 1.00 it is a definitive "buy" signal. Right now that measurement is .93. .93 = BUY with both hands. Here's the chart:

fvzsp2.gif

http://truthingold.blogspot.com/2011/12/this-is-my-favorite-time-of-year-and-im.html
 
It looks likes this chart only goes to 2008, I wonder what it looks like today... But I really liked the article.
 
au0730lf_ma.gif


Divide the red by the green to get the rgold value. You can tell it's less than one as the spot is below the 200 mda right now.
 
I have built a fairly sophisticated analyzer for this, which breaks down price into deviation between multiple DMAs, and trained for buy/sell signals against a long price history. I put a ton of work into it, and it's aware of things like options expiry dates and so on. I fire it up from time to time and try to tweak it with new inputs.

However I have found that P/DMA200 and the obvious options expiry leadups are about as good as it gets for buy indicators, for the amount of work involved (i.e. not much!)...
 
That Rgold metric is very interesting PMBug. But. that would seem very close to the more famous "BTFD".

I pretty much buy when I get some money come in, whatever the gold price is. I do not trade (I have explained elsewhere, especially to DCFusor, my inability to master short-term trading).

And, I do not sell my gold. I hope to GIVE it away!
 
So I've been playing with the price analyzer again tonight - this thread got me interested in it again - and have cobbled together an annotated screenie from a test run.

It's probably clear as mud - not really ready for public viewing due to all the debugging crud involved - but a few things can be seen.

In rough terms it predicts price movements in GLD (mainly timing reversals - actually getting prices correct is usually asking a bit too much) about ~20 days in advance. It's based on similar principles to RGOLD (P/DMA200) but taken quite a bit further.

It takes a few hours to crunch through the price history on my laptop and sometimes gets things waaay wrong, but I'm seeing good things happen quite often.

The test run below was adjusted so the system is completely blind to the last six month's worth of price info. It doesn't do too well predicting magnitude, but timing is excellent. Allowing it to train up to the current day (i.e. not blinding it to the last 6 months) gives a fair estimate of any big price changes over the next 2-3 weeks.

I'm doing a proper run right now, will post a follow up if the output doesn't look too ridiculous. The biggest problem with it - apart from being a nightmare to configure and test - is the fact that you can never quite tell when its going to throw you under a bus and produce nonsense. It's an ongoing battle to figure out if that's a glitch or a general limitation.

NB: do not use this for trading. It's an experimental tech toy. YMMV!

analyzer.png
 
(follow up to last post...)

I have recorded a video for one half of a sim/training session, showing the system learning to 'fit' the behaviour in the price history. Bear in mind that it's 'fitting' a 20-trading-day (1 month) price offset, so it's not a small feat. i.e. it has to learn the price on day D=X, for known prices at D<=(X-OFFSET), and do it without simply memorizing.

The sim is still running, so I'll upload the full video when it's completed and joined up.
 
Very cool stuff h4rdware. Looks like you put a lot of work into your project. :mrt:
 
PMBug - yes there's a ton of work in that thing, but as I said, fun as it might be to look at 'price predictions', you can do just as well with a lot less. I'd like to automate it and get 'daily readings' to score over time but still too busy with other stuff. Will get there eventually.

It's been running 6 hours now and probably time to stop it. Will post a video link later on, (pending correctly installed codecs and other garden variety PC problems).
 
Ok, here's a link to the simulation video. It's a lot less exciting than I was hoping for - one snap every 2 seconds, over 6 hours or so. It really needs sped up another 8x to get a feel for what's going on, but I'm out of time on this tonight. This machine is not set up for postproduction stuff, it was painful to get that far.

http://dl.dropbox.com/u/12947585/trainedsim.wmv

So if you have the patience of a zombie, you can see the 'fit line' gradually converging on the true price history, and a bit of a projection to the right edge, beyond the vertical white line. That's the "today's date" line. Anything beyond that line is either prescience, or nonsense ;-) it takes a long time to settle down.

For the less patient, I cobbled a 4-frame sequence from beginning, middle, end to show the same thing.

4shots.png


It's important to realize the spikes are ironed out and not reproduced very well. So even if it makes a decent job of projecting prices, it won't necessarily follow that line. The line is a guide to the 5-day-average approximately, and timing of reversals, but not much more than that.

The reason it takes so long, is because it's fighting a tough battle - lots of competing influences, some more subtle than others. If it fits too quickly, it's probably memorizing and that's bad for prediction. The more trouble it has fitting, the more general the fit, and the better it works. It's not quite that simple, but near enough.


My interpretation of the result? That's maybe a step too far, but here goes....

- early middle of a bottoming out parabola
- averages something like 1640-1680 for at least a month - probably longer, unless something dark and swan-shaped occurs
- suggests a fair recovery around mid-late-Jan or early Feb but possibly short lived
- no crash in price evident, just grinding along for a bit

...and...

- if something big and new happens, this result will be dead in the water. its not magic.
- it only tries to look a month ahead, so the next run might say something different!

Please don't trade on this. It's not wise. We'll see what happens and it'll be a bit of fun. I'll post updates now and again when I have the time.
 
(update)

I let the sim run a few more hours beyond the recording, and all that changed was a firming of the recovery/uptrend, and a little earlier. The red colour (sell warning) firmed to white up to about 1680 (suggesting it's not temporary), turning red beyond 1680-1720 mid-late Jan. The recovery path pulled to the left a bit (i.e. sooner).

So much the same, but recovery perhaps a bit sooner and a bit more solid than I reported last. No radical flip-flopping. We'll see what happens...
 
DiD posted a follow up:
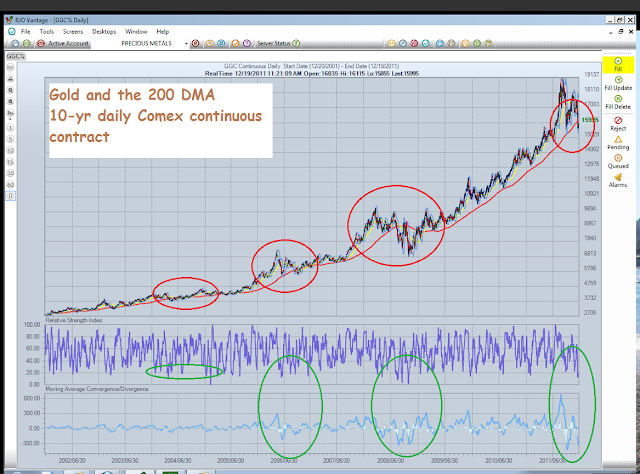
... let's look at the 10-year track record of gold vs. its 200 dma, after all there's nothing like showing the hard data in all of its glorious golden truth:

Goldvs200dma.png


That chart pretty much speaks for itself. Gold has breached its 200 dma to the downside many times over the last 10 years. Ironically, once that has occurred - in each and every occurrence - gold has always resumed its bull trend and powered to new nominal record highs. That evidence is indisputable. Any research that forecasts bad news for gold based on it breaking its 200 dma is unequivocally incorrect and therefore useless to the goal of making money and preserving wealth in the precious metals market. Unequivocally.
...

More: http://truthingold.blogspot.com/2011/12/gold-vs-200-day-moving-average.html

It occurs to me that looking at the chart in this manner seems to be a variation of Alf Field's Elliott Wave.
 
Back
Top Bottom