Dave in Denver:
http://truthingold.blogspot.com/2011/12/this-is-my-favorite-time-of-year-and-im.html
...
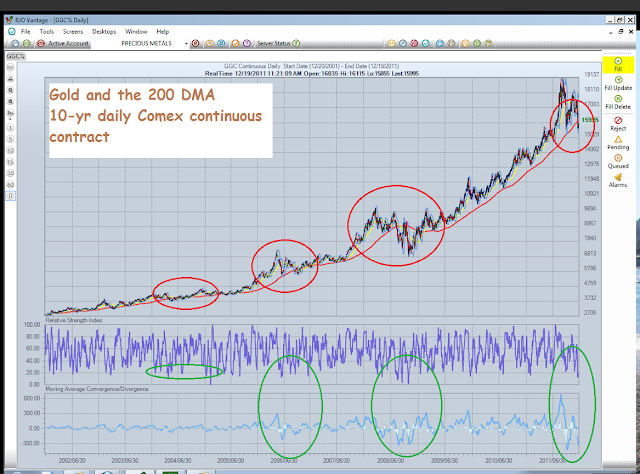
Here's a "technical" chart that you won't find in Gartman's letter but I will give it to you for free. Unfortunately Eric Hommelberg does not freely publish his work anymore but he follows a metric known as Rgold. This is the spot price of gold divided by the 200 dma of gold. The chart I have only shows 2004-2008, but you'll note that whenever the Rgold metric goes above 1.20 it is a definitive "sell" signal AND whenever it goes below 1.00 it is a definitive "buy" signal. Right now that measurement is .93. .93 = BUY with both hands. Here's the chart:

http://truthingold.blogspot.com/2011/12/this-is-my-favorite-time-of-year-and-im.html