Au-Myn
Fly on the Wall
Silver hitting right at 32.75 at the moment. Will it hold/break through?
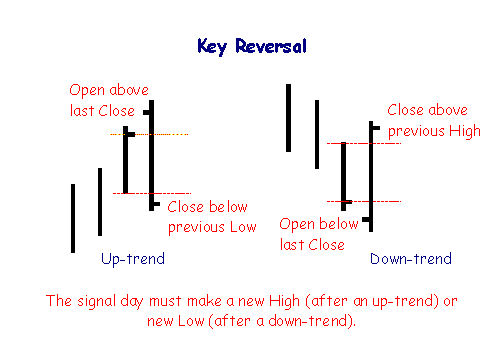
There were two technical buy signals given for Silver today.
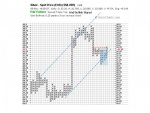
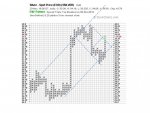
Later today I'll post a P & F chart when stockcharts updates their chart.

Welcome to the PMBug forums - a watering hole for folks interested in gold, silver, precious metals, sound money, investing, market and economic news, central bank monetary policies, politics and more.
Why not register an account and join the discussions? When you register an account and log in, you may enjoy additional benefits including no Google ads, market data/charts, access to trade/barter with the community and much more. Registering an account is free - you have nothing to lose!
Silver hitting right at 32.75 at the moment. Will it hold/break through?
Silver hitting right at 32.75 at the moment. Will it hold/break through?
I'm going to go out on a limb with a definitive answer - Nope. ;-)Silver hitting right at 32.75 at the moment. Will it hold/break through?
I'm going to go out on a limb with a definitive answer - Nope. ;-)
Gold spot price (GOLDS-1,714.80) carried little immediate effect regarding a pick up in demand when the margin requirement for the gold futures was lowered mid month. Recent behavior has been unusual in that the dollar and gold have both withdrawn in price (they usually perform inversely). Gold appears weak (see Figure 10) and may need to extend the ongoing consolidation.
...
Support currently lies at the 40-week MA, 1,670, with 1,600-1,526 remaining the major critical support, were the negative momentum influence to cause further weakness. Were supports to break, 1,500 and 1,400 would return to the risk profile. One-year resistance is unchanged at the 1,800 level, with near-term resistance at 1,750.
...
Silver spot price (SILV-33.41) carries a similar pattern to Gold with the 40-week MA right at price support of 31, with the 2008 uptrend at 30, and the year-long resistance still at 35, as depicted herein last month. However, the weekly momentum is still positive but precariously flat; the monthly is still negative and also flattening. There is a symmetry pattern similar to Gold again suggesting further consolidation may be necessary if price can’t move through resistance at 35 over the near term. Critical support remains at 27-25.
...

http://www.gotgoldreport.com/2013/02/history-of-the-death-cross-in-charts-.htmlHistory of the 'Death Cross' in Gold and Silver Charts
HOUSTON -- We thought we would publish charts showing the history of the so-called "Death Cross" for gold and silver since 2000, when the previous gold bear market arguably ended and the current bull market began. We offer these charts for what they are worth given the dozens of times the "Death Cross" has been mentioned today in televised financial media.
The very simple charts speak for themselves.

The circles indicate each of the previous events where the 50-day moving average has crossed below the 200-day moving average. Commonality can be found in at least one observation. Each of the events occurred at a higher, not lower level.
Rhetorical question: Does that mean that a "Death Cross" is actually a contrary bullish indicator?
Below is the same chart for silver.

One last point: Neither gold nor silver "knows" where the moving averages are currently. If the Death Cross is supposed to be a major bearish signal, then the metals have not been cooperative to the notion, so far. (Except for brief periods, such as the Great Panic of 2008.)

... We're in massive trouble now. ...

Stacking is certainly going to be fun
Regarding price performance, it's going to be an epic battle to go back above 1525. There's massive resistance.
Everything is set up for a short squeeze obviously, but the question remains at which level it is going to start...
stackers should just wait for big down days. They shouldn't try to be technicians. Hell.. I'm not sure anyone should try to be a technician in this crap.
") that's what I do, I listen to all you more experienced traders here, and then I buy only when I feel it in my piss, that it might be it... So far, so good - a bit in red with my gold (but should easily break into green with today's stunt - unless the bottom fells out...), rather firmly in green for silver - and many thanks to all of you for picking your collective brains...
that's what I do, I listen to all you more experienced traders here, and then I buy only when I feel it in my piss, that it might be it... So far, so good - a bit in red with my gold (but should easily break into green with today's stunt - unless the bottom fells out...), rather firmly in green for silver - and many thanks to all of you for picking your collective brains... http://www.bespokeinvest.com/thinkbig/2013/4/15/gold-trades-at-most-oversold-levels-on-record.htmlGold Trades at Most Oversold Levels on Record
Monday, April 15, 2013 at 11:39AM
The price of gold is currently trading more than 4.5 standard deviations below its 50-day moving average, which clocks in at the most oversold reading since at least 1975. The chart below shows the daily overbought/oversold reading for gold based on the number of standard deviations it traded above or below its 50-day moving average. As shown, there have not been very many occurrences where the commodity traded more than 3.5 standard deviations below its 50-day moving average. In fact, there have only been ten.

Earlier today, we sent out a report to Bespoke Premium clients highlighting how gold and the S&P 500 performed in the past following each of these periods. Interestingly, there were some clear trends for each asset. Clients wishing to view this morning's report can click on the link below. If you are not yet a Bespoke Premium client, sign up today!
 . I am firmly in the red, (finally...), for both silver and gold, and I am fully prepared to be deeply in the red, and then take on significantly more.
 ...
There may be less volatility the next few days, Eric. The market may take a breather because China is out of the market until Thursday, with a national holiday, and other countries will be on holiday when they celebrate May Day this Wednesday. These holidays will mean reduced trading volumes, ...
Louise Yamada said:...
The current Gold pattern is badly damaged technically (the bigger the drop the longer the need for repair). There is no guarantee the low has been seen, and we would advise against bottom fishing, which can be dangerous to one’s wealth. Most likely there will be rallies, as have come into place, and retreats as the supply-demand factors battle it out. A consolidation should lie ahead that either could begin a repair process, or a consolidation that could be followed by a new low (as those not having sold decide to do so on a bounce), or at best a test of the current low of 1,347.95.
...