swissaustrian
Yellow Jacket
- Messages
- 2,049
- Reaction score
- 0
- Points
- 156
I've had a long discussion with a Keynesian about the issue of money lately. He maintained that the 2% annual inflation goal of the FED (and many other central banks) would ensure "price stability". I told him that he doesn't understand simple math and that 2% annual inflation annihilated the savings function of money. So I went on to calculate a few examples for him. (I'll get into the phony statistical tricks behind CPI calculations later)
- Assuming the FED is successful in maintaining 2% annual inflation for 10 years ("over the medium term" as central bankers say"), it doesn't mean we have 20% inflation in 10 years, it means 21.9% (1.02^10 = 1.02*1.02*1.02... and so on) . Over twenty years we already get 48.6% (not 40%), over thirty 81.1% (not 60%). This means that our glorious money loses 4/5 of it's purchasing power every generation. If the FED just got the inflation targeting wrong by 0.1% over the same timeframes we'd get 23.1% (10y) / 51.5% (20y) / 86.5% (30y). As you can see, even very small changes make a significant difference.
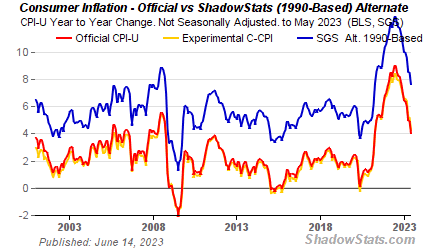
- That brings the CPI into the game. It's basicly an open secret that the CPI is beeing massaged. First of all, it is against the fundamental principle of statistics to change the composition and calculation of an index basicly every year. That destroys any comparative value of annual data. Second of all, setting an index back to 100 every few years is just as deceptive as 2% inflation in the first year is less then 2% in the tenth year (see above). We all know the reasons why governments are doing this: economic indicators like GDP look better and CPI linked goverment payouts (like SS) don't have to be increased as much. Additionally, cold progression on income taxes doesn't look as cruel. Now let's assume that John Williams' (shadowstats) calculation of the CPI is more accurate than the official one.
For simplicity purposes, let's assume that real annual inflation was 5% instead of 2%. According to Mr Williams it was actually even higher than 5%:

Comparison 2% vs 5% over 10/20/30 years:
10y: 21.9% vs 62.9%
20y: 48.6% vs 265.3%
30y: 81.1% vs 432.2%
Q.E.D. :judge:
- Assuming the FED is successful in maintaining 2% annual inflation for 10 years ("over the medium term" as central bankers say"), it doesn't mean we have 20% inflation in 10 years, it means 21.9% (1.02^10 = 1.02*1.02*1.02... and so on) . Over twenty years we already get 48.6% (not 40%), over thirty 81.1% (not 60%). This means that our glorious money loses 4/5 of it's purchasing power every generation. If the FED just got the inflation targeting wrong by 0.1% over the same timeframes we'd get 23.1% (10y) / 51.5% (20y) / 86.5% (30y). As you can see, even very small changes make a significant difference.
- That brings the CPI into the game. It's basicly an open secret that the CPI is beeing massaged. First of all, it is against the fundamental principle of statistics to change the composition and calculation of an index basicly every year. That destroys any comparative value of annual data. Second of all, setting an index back to 100 every few years is just as deceptive as 2% inflation in the first year is less then 2% in the tenth year (see above). We all know the reasons why governments are doing this: economic indicators like GDP look better and CPI linked goverment payouts (like SS) don't have to be increased as much. Additionally, cold progression on income taxes doesn't look as cruel. Now let's assume that John Williams' (shadowstats) calculation of the CPI is more accurate than the official one.
For simplicity purposes, let's assume that real annual inflation was 5% instead of 2%. According to Mr Williams it was actually even higher than 5%:

Comparison 2% vs 5% over 10/20/30 years:
10y: 21.9% vs 62.9%
20y: 48.6% vs 265.3%
30y: 81.1% vs 432.2%
Q.E.D. :judge:
Last edited:
