gold etfs inflows and outflows

Welcome to the Precious Metals Bug Forums

Welcome to the PMBug forums - a watering hole for folks interested in gold, silver, precious metals, sound money, investing, market and economic news, central bank monetary policies, politics and more. You can visit the forum page to see the list of forum nodes (categories/rooms) for topics.

Why not register an account and join the discussions? When you register an account and log in, you may enjoy additional benefits including no Google ads, market data/charts, access to trade/barter with the community and much more. Registering an account is free - you have nothing to lose!

pmbug

Your Host
Administrator
Benefactor
Messages
14,510
Reaction score
4,565
Points
268
Location
Texas
United-States
The biggest banking crisis since the Great Financial Crisis of 2008 prompted investors to flee into gold last month, ending ten consecutive months of outflows, according to the latest report from the World Gold Council.

In its monthly ETF report, the WGC said 32 tonnes of precious metal, worth $1.9 billion, flowed in global gold-backed exchange-traded products in March.
...
Looking at regional data, the report said that North American-based funds saw inflows of 12 tonnes last month, worth $806 million. At the same time, European funds saw inflows of 18 tonnes, valued at $927 million. Finally, the Asian ETF market saw inflows of 3 tonnes, worth $203 million.

Although March saw the gold ETF market sharply turn, demand last month wasn't enough to undo a relatively disappointing start to the year. The WGC said that gold-backed ETFs saw net outflows of 28.7 tonnes worth $1.5 billion in the first quarter of 2023.
...

 
Global physically backed gold ETFs1 saw a small outflow of US$920mn in the month, significantly narrower than the previous month.2 Holdings lowered to 3,236t, a 9t decline in November, while total AUM rose by 2% to US$212bn, supported by a meaningful 2% rise in the gold price.3

Regional highlights

North American funds attracted net inflows of US$659mn in November, putting a stop to the region’s five-month losing streak. ...

 
240106Chart-1.jpg


Since 2022 in- and outflows on one side and gold price on the other side have decoupled.
The expectation More ETFs inflows = more demand = higher price, seems to have no empirical base anymore.
 
So Western ETFs outflows ---> Asian ETFs inflows
I'm shocked :D

Beside, the prophecy says, the end of the days will see gold ETFs net outflows notwithstanding increased investment demand, in order to compensate for supply/demand imbalances.
In other words, those outflows is not investors selling because they think price will go down.
Rather it's metal requested by wholesalers and their customers, manufacturers/producers, that can't find metal anymore on the market.
 
GHqvzOrWAAEQYmZ


It looks like GLD has become a major source for physical gold
 
Gold-backed exchange-traded products are showing signs of life as they attracted some attention from North American investors last month, even as European markets continued to see significant outflows, according to the latest data from the World Gold Council (WGC).

The WGC released its latest report on monthly ETF flows on Tuesday, which showed that global outflows dropped to their slowest rate since February 2020 and are 21% lower than the month-end record of 3,915t in October.

The analysts noted that North American-listed funds saw holdings actually increase by 4.8 tonnes, valued at $360 million.
...

More:


Wall Street is waking up on gold...
 
Watch PMs flow from the westvto the east. Once they get to China and India they are not coming back for a long time if ever. Also think about if Russia and South Africa become selective in their export partners.
 
Highlights
  • Global gold ETFs saw a continuation of monthly outflows, despite early-April inflows spurred by the gold price strength.
  • Asia led global inflows and North American funds registered positive demand; but these were dwarfed by European outflows.
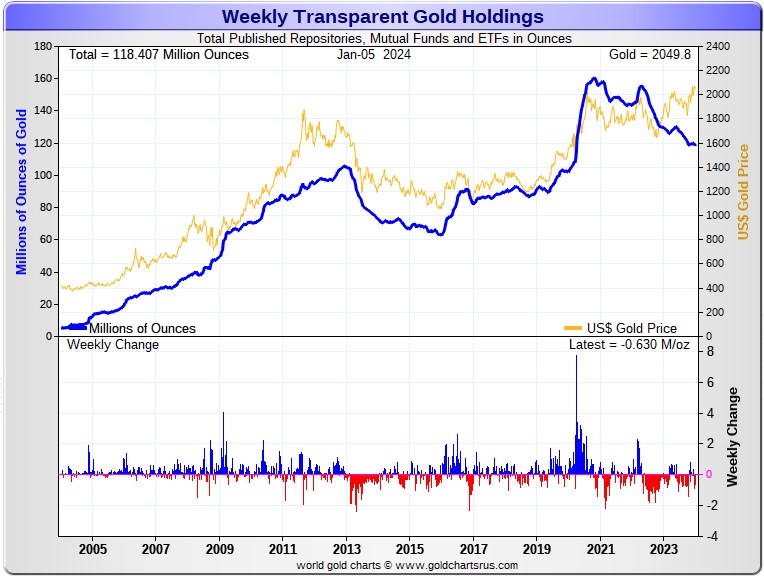
  • End April saw global gold ETF holdings fall to 3,079t, the lowest since February 2020. But the higher gold price in the month extended total AUM by 3% to US$229bn.
  • Gold ETF trading volumes increased across all regions, with a surge in North America, indicating continued investor interest despite outflows.
...
North American funds saw their second consecutive monthly inflow, albeit small, attracting US$124mn in April. As in March, the strong gold price performance triggered in-the-money (ITM) call options of major gold ETFs, creating sizable inflows. ...

Even after accounting for these inflows, North America heads the regional outflows, losing US$4bn y-t-d, mainly due to notable outflows during January and February. But while the region’s collective holdings fell further, their AUM rose to US$117bn – the highest since April 2022, 10% below the month-end peak of US$129bn recorded in August 2020.

Europe once again led global outflows, losing US$4bn in April and representing the eleventh consecutive month of losses. Funds listed in the UK, France and Germany led outflows. ...

April compounded Europe’s y-t-d losses to nearly US$7bn, with the UK, Switzerland and Germany accounting for most of the region’s outflows. But accounting for higher prices, AUM in European funds have increased by 3% since the beginning of 2024.

April (+US$1bn) extended Asian funds’ inflow streak to 14 months. China was the main engine in the month, where gold ETFs witnessed not only record monthly inflows (+US$1bn) but also reached their highest AUM ever. And the growth in assets amounts to a stunning 36% so far in 2024. In general, a sluggish equity market, expectations of a weaker local currency, increasing promotional efforts from ETF providers’ and strong price performance were the main drivers. Pushed by China’s sizable inflows, Asian funds have, collectively, added US$2bn during the first four months of 2024; their total AUM has jumped 35% y-t-d, rising to the highest on record.

Funds in the other region saw mild outflows during the month, losing US$65mn, driven mainly by Australia and South Africa. At the end of April, the region’s y-t-d outflows amount to US$58mn, with Australia accounting for the bulk.
...

 
Back
Top Bottom