You are using an out of date browser. It may not display this or other websites correctly.
You should upgrade or use an alternative browser.
You should upgrade or use an alternative browser.
The Lunatic Fringe - Market and Trade Chat
- Thread starter TheRealZed
- Start date
-
- Tags
- markets
Welcome to the Precious Metals Bug Forums
Welcome to the PMBug forums - a watering hole for folks interested in gold, silver, precious metals, sound money, investing, market and economic news, central bank monetary policies, politics and more.
Why not register an account and join the discussions? When you register an account and log in, you may enjoy additional benefits including no Google ads, market data/charts, access to trade/barter with the community and much more. Registering an account is free - you have nothing to lose!
- Status
- Not open for further replies.
TheRealZed
Retired Sailor
- Messages
- 3,002
- Reaction score
- 3,607
- Points
- 298
Looked like a bash and cover operation to me!
TheRealZed
Retired Sailor
- Messages
- 3,002
- Reaction score
- 3,607
- Points
- 298
TheRealZed
Retired Sailor
- Messages
- 3,002
- Reaction score
- 3,607
- Points
- 298
TheRealZed
Retired Sailor
- Messages
- 3,002
- Reaction score
- 3,607
- Points
- 298
TheRealZed
Retired Sailor
- Messages
- 3,002
- Reaction score
- 3,607
- Points
- 298
TheRealZed
Retired Sailor
- Messages
- 3,002
- Reaction score
- 3,607
- Points
- 298
TheRealZed
Retired Sailor
- Messages
- 3,002
- Reaction score
- 3,607
- Points
- 298
TheRealZed
Retired Sailor
- Messages
- 3,002
- Reaction score
- 3,607
- Points
- 298
TheRealZed
Retired Sailor
- Messages
- 3,002
- Reaction score
- 3,607
- Points
- 298
TheRealZed
Retired Sailor
- Messages
- 3,002
- Reaction score
- 3,607
- Points
- 298
So now we've made Jan look Fab... short the MF!!!!!!
Last edited:
TheRealZed
Retired Sailor
- Messages
- 3,002
- Reaction score
- 3,607
- Points
- 298
About a gold backed dollar.
TheRealZed
Retired Sailor
- Messages
- 3,002
- Reaction score
- 3,607
- Points
- 298
TheRealZed
Retired Sailor
- Messages
- 3,002
- Reaction score
- 3,607
- Points
- 298
The Acid Capitalist on MSM...
Gold seeping into the mainstream?
Gold seeping into the mainstream?
TheRealZed
Retired Sailor
- Messages
- 3,002
- Reaction score
- 3,607
- Points
- 298
TheRealZed
Retired Sailor
- Messages
- 3,002
- Reaction score
- 3,607
- Points
- 298
TheRealZed
Retired Sailor
- Messages
- 3,002
- Reaction score
- 3,607
- Points
- 298
Holy f'ing jeepers, has the race to the bottom started in earnest yet?
TheRealZed
Retired Sailor
- Messages
- 3,002
- Reaction score
- 3,607
- Points
- 298
Pile up the cash...
Betting on "the big short" once again?
Betting on "the big short" once again?
TheRealZed
Retired Sailor
- Messages
- 3,002
- Reaction score
- 3,607
- Points
- 298
It's interesting... (posted earlier)
TheRealZed
Retired Sailor
- Messages
- 3,002
- Reaction score
- 3,607
- Points
- 298
TheRealZed
Retired Sailor
- Messages
- 3,002
- Reaction score
- 3,607
- Points
- 298
TheRealZed
Retired Sailor
- Messages
- 3,002
- Reaction score
- 3,607
- Points
- 298
DoubleLine Capital's take...
TheRealZed
Retired Sailor
- Messages
- 3,002
- Reaction score
- 3,607
- Points
- 298
Nobody is sure how this will play, even some of the shorters are scared to short!
- Messages
- 392
- Reaction score
- 877
- Points
- 268
Tom Luongo to the Fed: Go BIG or go home.
[Fifty basis points.]
 tomluongo.me
[Fifty basis points.]

This Week's FOMC: What Does Jay Powell Really Care About? - Gold Goats 'n Guns
With the markets still firmly convinced the Federal Reserve will hike the Fed Funds Rate by just 25 basis points (0.25%) on Wednesday, I find it fascinating that no less a figure than Mohamed El-Erian, former head of PIMCO, argued for the Fed to stay the course and surprise markets with another...
 tomluongo.me
- Messages
- 153
- Reaction score
- 266
- Points
- 198
Hemke thinks it'll be 25 basis points:
https://www.sprottmoney.com/blog/The-Busy-Week-Ahead-January-31-2023
https://www.sprottmoney.com/blog/The-Busy-Week-Ahead-January-31-2023
While the markets/everyone are waiting on the Fed today, some FWIW data:
... the headline manufacturing index from the Institute for Supply Management disappointed expectations in January, contracting for the third month in a row.
The ISM manufacturing index was at 47.4% last month versus the consensus forecast of 48%. The monthly figure also marked a one-percentage-point decrease from December’s reading of 48.4%.
...
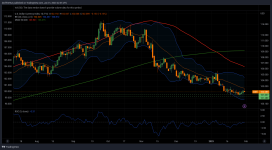
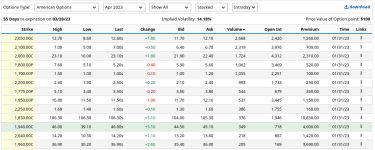
Agreed, I've sold a couple Put spreads dipping my toe into the water. Think I have the $10-$8 spread and $8.5-6.5 spread on UNG. Energy is energy and we need every form we can get. Except for nat gas all the sudden, lol. Somehow cheaper than when oil went negative. I had to go look up actual energy contents and looks like 1 BOE (barrel of oil equvalent) is ~5.55 mmBtu (common nat gas measurement). That's about 18% and we shouldn't really go below that level. Edit: It looks like 18% is low and I forgot you would need a bunch more energy to refine the oil so that probably accounts for the higher natural levels.
View attachment 6509
Well natural gas is still collapsing today. Glad I went small. I'll add when I see some signs of a bottom and get some more cash.

...
The Committee seeks to achieve maximum employment and inflation at the rate of 2 percent over the longer run. In support of these goals, the Committee decided to raise the target range for the federal funds rate to 4-1/2 to 4-3/4 percent. The Committee anticipates that ongoing increases in the target range will be appropriate in order to attain a stance of monetary policy that is sufficiently restrictive to return inflation to 2 percent over time. In determining the extent of future increases in the target range, the Committee will take into account the cumulative tightening of monetary policy, the lags with which monetary policy affects economic activity and inflation, and economic and financial developments. In addition, the Committee will continue reducing its holdings of Treasury securities and agency debt and agency mortgage-backed securities, as described in its previously announced plans. The Committee is strongly committed to returning inflation to its 2 percent objective.
In assessing the appropriate stance of monetary policy, the Committee will continue to monitor the implications of incoming information for the economic outlook. The Committee would be prepared to adjust the stance of monetary policy as appropriate if risks emerge that could impede the attainment of the Committee's goals. The Committee's assessments will take into account a wide range of information, including readings on labor market conditions, inflation pressures and inflation expectations, and financial and international developments.
...
Federal Reserve issues FOMC statement
Recent indicators point to modest growth in spending and production. Job gains have been robust in recent months, and the unemployment rate has remained low. I
www.federalreserve.gov
TheRealZed
Retired Sailor
- Messages
- 3,002
- Reaction score
- 3,607
- Points
- 298
TheRealZed
Retired Sailor
- Messages
- 3,002
- Reaction score
- 3,607
- Points
- 298
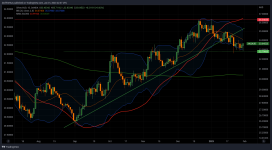
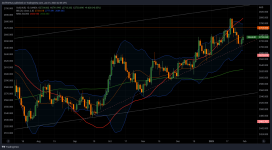
Gold and Silver are still in the correction window, not out of the woods yet.
TheRealZed
Retired Sailor
- Messages
- 3,002
- Reaction score
- 3,607
- Points
- 298
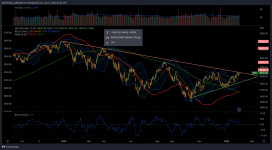
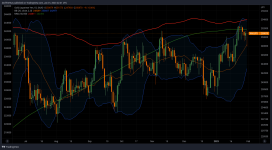
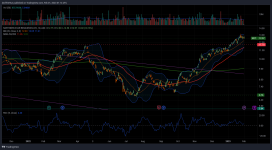
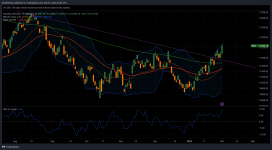
NasDaq Daily - Looks OK here, for now. Monthly ROC is about to go positive, typically we either rally for a few months or sell off from that point. Does this year become a classic sell in May? I have to say that after a big sell off the first test of the 0 line on the monthly ROC tends to be a sell. Not a lot of data on that, however...

TheRealZed
Retired Sailor
- Messages
- 3,002
- Reaction score
- 3,607
- Points
- 298
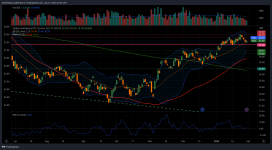
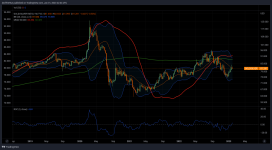
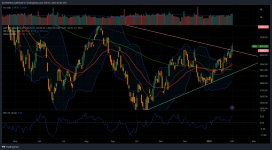
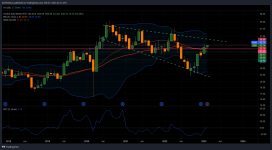
GDX Monthly - Stepping back and looking at this broadening formation, it looks like we are close to the start gun on what should be a very big move. +35 monthly close (closing trend) or for the conservative +38/39 (recent highs).
It would be brutal if we swung back to the formations lower bound one more time, not impossible... but DAMN! If we ever see 18 again BUY it all... LOL.
It would be brutal if we swung back to the formations lower bound one more time, not impossible... but DAMN! If we ever see 18 again BUY it all... LOL.

TheRealZed
Retired Sailor
- Messages
- 3,002
- Reaction score
- 3,607
- Points
- 298
- Messages
- 392
- Reaction score
- 877
- Points
- 268
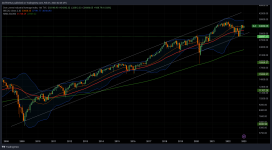
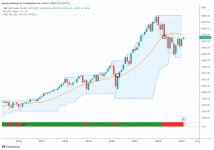
@Zed Here is my monthly SPX chart. What I see is a possible A-B-C downward move.
We've made the A move down. We get the B little bounce. Then, if it should occur, we get the C move down equal in length to the A move down.
Rough calculations that puts us to around 3000 on SPX.
[Not predicting, just looking.]
We've made the A move down. We get the B little bounce. Then, if it should occur, we get the C move down equal in length to the A move down.
Rough calculations that puts us to around 3000 on SPX.
[Not predicting, just looking.]

- Status
- Not open for further replies.

