
You are using an out of date browser. It may not display this or other websites correctly.
You should upgrade or use an alternative browser.
You should upgrade or use an alternative browser.
The Lunatic Fringe - Market and Trade Chat
- Thread starter TheRealZed
- Start date
-
- Tags
- markets
Welcome to the Precious Metals Bug Forums
Welcome to the PMBug forums - a watering hole for folks interested in gold, silver, precious metals, sound money, investing, market and economic news, central bank monetary policies, politics and more.
Why not register an account and join the discussions? When you register an account and log in, you may enjoy additional benefits including no Google ads, market data/charts, access to trade/barter with the community and much more. Registering an account is free - you have nothing to lose!
- Status
- Not open for further replies.
TheRealZed
Retired Sailor
- Messages
- 3,002
- Reaction score
- 3,606
- Points
- 298
What ever.
Ruh ro. Regression, he has become a teenager again.
...
Thursday, the U.S. Labor Department said its much-anticipated Consumer Price Index fell 0.1% last month after a 0.1% rise in November.
At the same time, annual inflation rose 6.5% last month, down from November's increase of 7.1%. The data was in line with consensus forecasts.
Core CPI, which strips out volatile food and energy prices, rose 0.3% last month, following a 0.2% rise in November. Core inflation also rose in line with economist estimates. For the year, core inflation rose 5.7%, down compared to November's increase of 6.0%.
...
Although inflation appears to be cooling at a fast face, some analysts note that it still remains elevated. Paul Ashworth, chief North America economist at Capital Economics, said that although inflation is falling its not enough for the Federal Reserve to change directions on monetary policy.
“Overall, this latest report adds more weight to our view that CPI inflation will fall more rapidly than the Fed expects this year. But the Fed isn’t going to stop raising interest rates until it sees accompanying evidence of an easing in labour market conditions and wage growth. It will be a couple more months before that evidence is also irrefutable,” he said in a note.

Gold prices push above $1,900 as annual U.S. CPI rises 6.5% in December, in line with expectations
(Kitco News) - Gold prices has pushed above $1,900 an ounce and is trading near session highs as U.S. consumer prices cool in December, in line with expectations.
www.kitco.com
... Philadelphia Fed president Patrick Harker ... declared that he is for a 25 basis points in three weeks saying 25bps ... "will be appropriate going forward." Harker is a voter on rates this year, so that tells us that, as of now, there’s at least one vote for 25 at the Feb. 1 meeting ...
“I expect that we will raise rates a few more times this year, though, to my mind, the days of us raising them 75 basis points at a time have surely passed,” Harker said in prepared remarks Thursday for an event in Malvern, Pennsylvania. “In my view, hikes of 25 basis points will be appropriate going forward.”
Harker also said he expects the Fed to get to just over 5% and then hold, and says it is likely the Fed will hike rates "a few" more times in 2023, although that's probably market dependent.
...
Philly Fed President Has Seen Enough: 25bps Hikes "Will Be Appropriate Going Forward" | ZeroHedge
ZeroHedge - On a long enough timeline, the survival rate for everyone drops to zero
 www.zerohedge.com


Another really good video by Rafi the Wise... Someone bought like 2,000+ contracts of Gold in the late period of Spot month. on like Monday.
- Messages
- 986
- Reaction score
- 1,406
- Points
- 278
David Stockman Reveals What Inflation Would Look Like in a True Free-Market Economy
From Doug Casey's INTERNATIONAL MAN
There is nothing more substantive than Bernanke’s original finger-in-the-air proposition that the Fed needed a 200 basis point cushion in the inflation rate in order to steer the economy clear of the dreaded 0.0% inflation line, the other side of which allegedly amounted to a black hole of deflationary demise.
But here’s the thing. There is not a shred of historical evidence that the US economy needs a 2.00% inflation guardrail to thrive, or any fixed rate of inflation at all.
For instance, even during the most difficult period of the 20th century—from 1921 to 1946 when the US economy experienced the Roaring Twenties boom, the Great Depression bust and the WWII rebound—there was abundant net economic growth over the period as a whole, accompanied by zero inflation.
In fact, the US economy nearly tripled in size during that quarter-century period. Real GDP expanded at a robust 3.64% per annum rate, and real GDP per capita rose by 2.55% per annum.
By contrast, between the 2007 pre-crisis peak and 2021, real GDP grew at only half that rate (1.72% per annum), while per capita real GDP increased by just 1.04% per year. That was just two-fifths of the rate of annual gain during 1921-1946.
Needless to say, it didn’t take any 2.00% inflationary guard rails to generate the salutary outcomes cited above for 1921-1946. The CPI index shown below posted at 542 in February 2021 and 541 a quarter century later in May 1946.
Purchasing Power of the Dollar, 1921 to 1946

As it had unfolded, there was zero CPI inflation during the Roaring Twenties; a severe deflation during the Great Depression, which merely reversed the war inflation of 1915-1920; and then a return to the 1921 price level during the booming but regimented economy of WWII.
Still, by the spring of 1946 the dollar’s purchasing power was 100% of what it had been in early 1921. It had not taken any net inflation at all to generate a near tripling of the nation’s economic output.
The implication is straightforward. To wit, the Fed doesn’t need a pro-inflation target of 2.00% per annum. Nor does it need any of its other macroeconomic targets for unemployment, jobs growth, actual versus potential GDP or the rest of the Keynesian policy apparatus. All of those variables are the job of the people interacting on the free market, producing whatever outcomes their collective actions happened to generate.
Indeed, macro-economic outcomes are not properly the business of the state at all. The Fed’s job is far more narrow. As originally conceived by its great architect, then Congressman Carter Glass, its mission was to keep the purchasing power of the dollar as good as the gold to which it was to be linked, and the banking system liquid and stable, as driven by the free market of borrowers and lenders.
As we have explained on other occasions, Congressman Glass called this a "bankers’ bank" and the term could not be more diametrically opposed to the central planners’ bank of Greenspan, Bernanke, Yellen, Powell and Brainard.
As Carter Glass saw it, no academician needed to stick his finger in the air and divine an inflation target. Nor did any modeler need to goal-seek his/her equations until they suggested the optimum U-3 unemployment rate relative to an arbitrary inflation target.
The fact is, the free market operating with sound gold-backed money was never inflationary. In that context, interest rates were also not a policy "tool" of the central bank, but the result of a market-clearing balancing of supply and demand.
As Carter Glass had arranged it, the Fed was not allowed to own government debt, nor did it have an activist arm now known as the FOMC empowered to intervene in the money and capital markets by buying and selling debt securities.
To the contrary, its avenue of operation was the discount window at the 12 regional Federal Reserve banks. The latter were authorized to advance funds to member banks, but only at a penalty spread above the free market interest rate, and also only on the basis of sound, self-liquidating collateral in the form of commercial paper that matured within a matter of months.
Given this mechanism, the dynamics of Fed policy were the opposite of today. Under the Glassian arrangement, the Fed’s balance sheet was the passive consequence of free market activity by commercial bankers and main street borrowers, not a mechanism to proactively steer the level of aggregate commerce and business activity.
Accordingly, the Fed’s value added stemmed not from wild-ass guesses about the inflation rate by PhDs like Lael Brainard, but from the grunt work of green-eyeshade accountants. Their job was to verify that bank loan collateral presented for funding at the discount window represented the obligations of sound borrowers, not speculators and high flyers, who would reliably repay under the terms of the underlying bank loan, thereby ensuring that the Fed’s discount loans would be repaid at term, too.
What this meant was that the Fed’s balance sheet was intended to reflect the ebb-and-flow of decentralized commerce and production on main street, not a centralized judgment by 12 people gathered on the banks of the Potomac about whether inflation and unemployment were too high, too low or just right.
That is to say, under the bankers’ bank arrangement the free market put an automatic check on CPI inflation. That’s because unsound speculative loans could not be easily made in the first place, since they were not eligible for discount at the Fed window.
And if demand for even sound loans got too frisky, interest rates would rise sharply, thereby rationing available savings until more of the latter could be generated or demand for the former was curtailed.
From Doug Casey's INTERNATIONAL MAN
There is nothing more substantive than Bernanke’s original finger-in-the-air proposition that the Fed needed a 200 basis point cushion in the inflation rate in order to steer the economy clear of the dreaded 0.0% inflation line, the other side of which allegedly amounted to a black hole of deflationary demise.
But here’s the thing. There is not a shred of historical evidence that the US economy needs a 2.00% inflation guardrail to thrive, or any fixed rate of inflation at all.
For instance, even during the most difficult period of the 20th century—from 1921 to 1946 when the US economy experienced the Roaring Twenties boom, the Great Depression bust and the WWII rebound—there was abundant net economic growth over the period as a whole, accompanied by zero inflation.
In fact, the US economy nearly tripled in size during that quarter-century period. Real GDP expanded at a robust 3.64% per annum rate, and real GDP per capita rose by 2.55% per annum.
By contrast, between the 2007 pre-crisis peak and 2021, real GDP grew at only half that rate (1.72% per annum), while per capita real GDP increased by just 1.04% per year. That was just two-fifths of the rate of annual gain during 1921-1946.
Needless to say, it didn’t take any 2.00% inflationary guard rails to generate the salutary outcomes cited above for 1921-1946. The CPI index shown below posted at 542 in February 2021 and 541 a quarter century later in May 1946.
Purchasing Power of the Dollar, 1921 to 1946
As it had unfolded, there was zero CPI inflation during the Roaring Twenties; a severe deflation during the Great Depression, which merely reversed the war inflation of 1915-1920; and then a return to the 1921 price level during the booming but regimented economy of WWII.
Still, by the spring of 1946 the dollar’s purchasing power was 100% of what it had been in early 1921. It had not taken any net inflation at all to generate a near tripling of the nation’s economic output.
The implication is straightforward. To wit, the Fed doesn’t need a pro-inflation target of 2.00% per annum. Nor does it need any of its other macroeconomic targets for unemployment, jobs growth, actual versus potential GDP or the rest of the Keynesian policy apparatus. All of those variables are the job of the people interacting on the free market, producing whatever outcomes their collective actions happened to generate.
Indeed, macro-economic outcomes are not properly the business of the state at all. The Fed’s job is far more narrow. As originally conceived by its great architect, then Congressman Carter Glass, its mission was to keep the purchasing power of the dollar as good as the gold to which it was to be linked, and the banking system liquid and stable, as driven by the free market of borrowers and lenders.
As we have explained on other occasions, Congressman Glass called this a "bankers’ bank" and the term could not be more diametrically opposed to the central planners’ bank of Greenspan, Bernanke, Yellen, Powell and Brainard.
As Carter Glass saw it, no academician needed to stick his finger in the air and divine an inflation target. Nor did any modeler need to goal-seek his/her equations until they suggested the optimum U-3 unemployment rate relative to an arbitrary inflation target.
The fact is, the free market operating with sound gold-backed money was never inflationary. In that context, interest rates were also not a policy "tool" of the central bank, but the result of a market-clearing balancing of supply and demand.
As Carter Glass had arranged it, the Fed was not allowed to own government debt, nor did it have an activist arm now known as the FOMC empowered to intervene in the money and capital markets by buying and selling debt securities.
To the contrary, its avenue of operation was the discount window at the 12 regional Federal Reserve banks. The latter were authorized to advance funds to member banks, but only at a penalty spread above the free market interest rate, and also only on the basis of sound, self-liquidating collateral in the form of commercial paper that matured within a matter of months.
Given this mechanism, the dynamics of Fed policy were the opposite of today. Under the Glassian arrangement, the Fed’s balance sheet was the passive consequence of free market activity by commercial bankers and main street borrowers, not a mechanism to proactively steer the level of aggregate commerce and business activity.
Accordingly, the Fed’s value added stemmed not from wild-ass guesses about the inflation rate by PhDs like Lael Brainard, but from the grunt work of green-eyeshade accountants. Their job was to verify that bank loan collateral presented for funding at the discount window represented the obligations of sound borrowers, not speculators and high flyers, who would reliably repay under the terms of the underlying bank loan, thereby ensuring that the Fed’s discount loans would be repaid at term, too.
What this meant was that the Fed’s balance sheet was intended to reflect the ebb-and-flow of decentralized commerce and production on main street, not a centralized judgment by 12 people gathered on the banks of the Potomac about whether inflation and unemployment were too high, too low or just right.
That is to say, under the bankers’ bank arrangement the free market put an automatic check on CPI inflation. That’s because unsound speculative loans could not be easily made in the first place, since they were not eligible for discount at the Fed window.
And if demand for even sound loans got too frisky, interest rates would rise sharply, thereby rationing available savings until more of the latter could be generated or demand for the former was curtailed.
Viking
Yellow Jacket
- Messages
- 399
- Reaction score
- 886
- Points
- 268
FWIW, here is my Friday night Weekend Trend Trader "newsletter."
The weekly IWM index price closed above its 10 week moving average, so our system is in condition green. This means that we can take new trades and we set our stop loss levels at 40%.
The stock scanner returned 1 sell signal and 23 buy signals.
DCT and PAYA are marked as DON’T BUY because the rise of each of their prices is the result of an acquisition announcement.
UAA and UA are both UNDER ARMOUR. UAA are CLASS A shares, and UA are CLASS C shares. I choose to not buy both of these because it decreases my diversification. I will buy only UAA because it’s Position Score is higher than UA.
At Tuesday's open I will purchase:
PRPL
FOSL
THRX
PTGX
TCMD
TGTX
FULC
EVER
TRUE
BORR
UAA
LTH
OIS
HL
This will put me back with 20 positions.
dpong
The weekly IWM index price closed above its 10 week moving average, so our system is in condition green. This means that we can take new trades and we set our stop loss levels at 40%.
The stock scanner returned 1 sell signal and 23 buy signals.
DCT and PAYA are marked as DON’T BUY because the rise of each of their prices is the result of an acquisition announcement.
UAA and UA are both UNDER ARMOUR. UAA are CLASS A shares, and UA are CLASS C shares. I choose to not buy both of these because it decreases my diversification. I will buy only UAA because it’s Position Score is higher than UA.
| Ticker | Name | PositionScore |
| PRPL | PURPLE INNOVATION INC | 25.09 |
| FOSL | FOSSIL GROUP INC | 21.10 |
| THRX | THESEUS PHARMACEUTICALS INC | 21.00 |
| PTGX | PROTAGONIST THERAPEUTICS INC | 19.92 |
| TCMD | TACTILE SYSTEMS TECHNOLOGY INC | 18.29 |
| TGTX | TG THERAPEUTICS INC | 17.64 |
| FULC | FULCRUM THERAPEUTICS INC | 16.41 |
| EVER | EVERQUOTE INC | 13.66 |
| DCT | DUCK CREEK TECHNOLOGIES, INC | DON'T BUY |
| TRUE | TRUECAR INC | 12.88 |
| BORR | BORR DRILLING LIMITED | 12.82 |
| UAA | UNDER ARMOUR INC (CLASS A SHARES) | 12.27 |
| UA | UNDER ARMOUR INC (CLASS C SHARES) | 11.60 |
| LTH | LIFE TIME GROUP HOLDINGS INC | 11.32 |
| OIS | OIL STATES INTERNATIONAL INC | 11.10 |
| HL | HECLA MINING COMPANY | 10.24 |
| DO | DIAMOND OFFSHORE DRILLING INC | 9.47 |
| NR | NEWPARK RESOURCES INC | 9.47 |
| PAYA | PAYA HOLDINGS INC | DON'T BUY |
| OII | OCEANEERING INTERNATIONAL INC | 8.82 |
| HLX | HELIX ENERGY SOLUTIONS GROUP INC | 8.32 |
| FF | FUTURE FUEL CORP | 7.54 |
| FOR | FORESTAR GROUP INC | 7.21 |
| ADMA | ADMA BIOLOGICS INC | SELL |
At Tuesday's open I will purchase:
PRPL
FOSL
THRX
PTGX
TCMD
TGTX
FULC
EVER
TRUE
BORR
UAA
LTH
OIS
HL
This will put me back with 20 positions.
dpong
Last edited:
- Messages
- 399
- Reaction score
- 886
- Points
- 268
Here is a weekly chart of IMVT.
After such a crazy week, I'm still holding IMVT with a gain of 69.09%. It violated the stop loss level violently mid-week, but it doesn't count until the close on Friday. So, we're still in the game.
[I still don't know what that was all about.]

After such a crazy week, I'm still holding IMVT with a gain of 69.09%. It violated the stop loss level violently mid-week, but it doesn't count until the close on Friday. So, we're still in the game.
[I still don't know what that was all about.]
Against a background of some recent 'better than expected' macro prnts that bolstered the 'soft landing' thesis spurring stocks higher and rate-hike-odds lower, the Empire Fed Manufacturing Survey just stole the jam out of the bulls' donuts.
The NYFed's general business conditions index crashed nearly 22 points to -32.9 this month (twice as bad as the weakest analyst estimate).
...
Empire Fed Manufacturing Survey Totally Collapses | ZeroHedge
ZeroHedge - On a long enough timeline, the survival rate for everyone drops to zero
www.zerohedge.com

- Messages
- 399
- Reaction score
- 886
- Points
- 268
Why Recession is Imminent in Three Charts - John Rubino
 rubino.substack.com
Why Recession Is Imminent, In Three Charts
Any one of these would be enough to make the case
rubino.substack.com
TheRealZed
Retired Sailor
- Messages
- 3,002
- Reaction score
- 3,606
- Points
- 298
Gold Daily - A correction looks due here. Support and resistance mud map below. $1876.5 very probable, $1833 to 17 on a spike low possible but I would not bet on it. Below that we are looking a little broken. Near term we want to see all daily closes over $1850 or so.

TheRealZed
Retired Sailor
- Messages
- 3,002
- Reaction score
- 3,606
- Points
- 298
THRX purchased at the open. Currently up 30%.
[Keep your winners, sell your losers.]
View attachment 6028
Well done... let them run.
TheRealZed
Retired Sailor
- Messages
- 3,002
- Reaction score
- 3,606
- Points
- 298
Silver Daily - Pennant target got hit.

New flag shaping up, looks like confidence is growing. Next targets on flag break ~$28 and ~$30... both legitimate previous resistance points.

By the looks of Silver any correction in gold will be on the shallower side.
My 2c FWIW.
New flag shaping up, looks like confidence is growing. Next targets on flag break ~$28 and ~$30... both legitimate previous resistance points.
By the looks of Silver any correction in gold will be on the shallower side.
My 2c FWIW.
TheRealZed
Retired Sailor
- Messages
- 3,002
- Reaction score
- 3,606
- Points
- 298
GDX Daily - I'm gonna speculate that GDX ~ 29.xx would be a good entry on a gold correction.

TheRealZed
Retired Sailor
- Messages
- 3,002
- Reaction score
- 3,606
- Points
- 298
BTC Daily - Didn't break lower, broke up instead. Looks like it will correct with gold, now we are looking for a higher low to establish a new up trend. 18592 to 18411 odd needs to hold on correction IMO.

TheRealZed
Retired Sailor
- Messages
- 3,002
- Reaction score
- 3,606
- Points
- 298
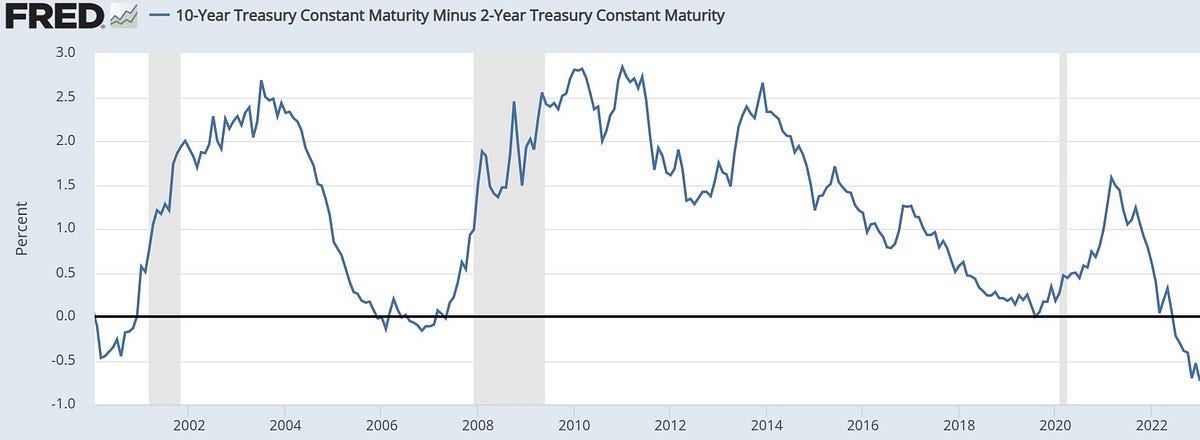
Ten Year Rate Daily - Looks a bit indecisive. My read of this chart is that the momentum is favoring more upside. We could end up range bound here for a bit. Short term it looks like a bounce is due.

- Messages
- 153
- Reaction score
- 266
- Points
- 198
I think it has been healthy for silver to stay in neutral while gold ran this month. I think some gold consolidation, as you mentioned, would be expected now, and probably be healthy. Silver may go down with it some, but OI is pretty small so perhaps the correction down, if it occurs, won't be too steep. I think before we start talking about $28 and $30 we need to decisively blast thru $24.50, and then remember that $26 has been an important number going all the way back to 2013. 2c...Silver Daily - Pennant target got hit.
View attachment 6035
New flag shaping up, looks like confidence is growing. Next targets on flag break ~$28 and ~$30... both legitimate previous resistance points.
View attachment 6036
By the looks of Silver any correction in gold will be on the shallower side.
My 2c FWIW.
TheRealZed
Retired Sailor
- Messages
- 3,002
- Reaction score
- 3,606
- Points
- 298
I think it has been healthy for silver to stay in neutral while gold ran this month. I think some gold consolidation, as you mentioned, would be expected now, and probably be healthy. Silver may go down with it some, but OI is pretty small so perhaps the correction down, if it occurs, won't be too steep. I think before we start talking about $28 and $30 we need to decisively blast thru $24.50, and then remember that $26 has been an important number going all the way back to 2013. 2c...
26.15 to .90 looks like a pause zone on the trip up. Clearly defined resistance zone.
TheRealZed
Retired Sailor
- Messages
- 3,002
- Reaction score
- 3,606
- Points
- 298
ASX Gold Tribe flat with a -ve bias today. +- 0.5% more -.
I liked this Silver chart from Steve Penny and WSS. A potential small pull-back to $21.50 or 200 dMA. Would be very good time to load up.

""
""
TheRealZed
Retired Sailor
- Messages
- 3,002
- Reaction score
- 3,606
- Points
- 298
I liked this Silver chart from Steve Penny and WSS. A potential small pull-back to $21.50 or 200 dMA. Would be very good time to load up.
Yeah, I'd say too low. I'd be worried of we hit that. The 50 DMA really needs to hold up @ the worst here. You want that ~23 level to hold... or better. Refer May/June/July 2020.
TheRealZed
Retired Sailor
- Messages
- 3,002
- Reaction score
- 3,606
- Points
- 298
GDXJ Weekly - Descending broadening formation, typically they resolve bullish about 80% of the time. Looking for a break of 46 or so before the move, classic T/A would have a target of ~90 based on the chart so far... however the 2020 washout is the base for that so I'm not so sure about the targeting.

...
The producer price index, which measures final demand prices across hundreds of categories, declined 0.5% for the month, the Labor Department reported Wednesday. Economists surveyed by Dow Jones had been looking for a 0.1% decline. The decline was the biggest on a monthly basis since April 2020.
...

Wholesale prices fell 0.5% in December, much more than expected
The producer price index was expected to decrease 0.1% in December, according to Dow Jones estimates.
The number: U.S. industrial production fell 0.7% in December, the Federal Reserve reported Wednesday. It is the biggest monthly decline since September 2021.
The decline was steeper than economists expectations of a 0.1% decline, according to a survey by The Wall Street Journal.
Output in November was revised down to a 0.6% drop, much worse than the initial estimate of a 0.2% decline.
...
- Messages
- 153
- Reaction score
- 266
- Points
- 198
Hemke talks silver/2023:
https://www.sprottmoney.com/blog/No-Interest-In-COMEX-Silver-January-17-2023
https://www.sprottmoney.com/blog/No-Interest-In-COMEX-Silver-January-17-2023
MarketWatch says market downturns are because of the data I mentioned in post #1867, but that data was publicized early this morning and the market didn't shit the bed until a couple of hours later if I'm reading the graphs right.

 www.marketwatch.com
Dow falls 350 points after data suggests economic growth is slowing
U.S. stock indexes trade mostly lower on Wednesday, after data showed retail sales fell in December though wholesale inflation also fell allowing bond yields...
Yeah, I'd say too low. I'd be worried of we hit that. The 50 DMA really needs to hold up @ the worst here. You want that ~23 level to hold... or better. Refer May/June/July 2020.
$23 is hardly even noticeable and not a correction. I like the $21.70 area as the 31% Fib level. Granted I think this means the stock market is going to be really rocky and not blasting upwards.

Looks like most markets shit the bed a little while ago. I wonder what sparked that.
My guess is they are finally realizing that the data is pointing towards a recession. At some point it always switches from Bad News = Good News (because the FED stops kicking them in the nuts) to Bad News = Bad News because now we see the damage from the repeated trauma to the economy.
- Messages
- 399
- Reaction score
- 886
- Points
- 268
Gregory Mannarino sent me an email that says:Looks like most markets shit the bed a little while ago. I wonder what sparked that.
Bulltard today stated that the Fed. may push their benchmark rate to over 5%, this was bad news for stocks…
HOWEVER….
It appears that that bond market is not buying it. No major move in the 10 year yield NOR any “safety trade” looking at dollar relative strength.
- Messages
- 21,513
- Reaction score
- 12,321
- Points
- 288
How come it is we're geniuses here and knew it was pointing that way a long while ago and they're just figuring it out?My guess is they are finally realizing that the data is pointing towards a recession.
Oldmansmith
Fly on the Wall
- Messages
- 50
- Reaction score
- 170
- Points
- 103
I think that it is the possibility of no agreement on raising the debt ceiling.Looks like most markets shit the bed a little while ago. I wonder what sparked that.
How come it is we're geniuses here and knew it was pointing that way a long while ago and they're just figuring it out?
They ALWAYS believe the banker (FED) fairytales. IE they are going to perfectly manage a soft landing and we won't have a recession.
TheRealZed
Retired Sailor
- Messages
- 3,002
- Reaction score
- 3,606
- Points
- 298
$23 is hardly even noticeable and not a correction. I like the $21.70 area as the 31% Fib level. Granted I think this means the stock market is going to be really rocky and not blasting upwards.
View attachment 6087
Yeah, but that is how silver goes if the move is solid.
TheRealZed
Retired Sailor
- Messages
- 3,002
- Reaction score
- 3,606
- Points
- 298
50% of the economy is government these days so I can't see them letting that happen, ever. I also can't understand how Wall Street believes that is a real threat.I think that it is the possibility of no agreement on raising the debt ceiling.
Maybe another temp shut down in a game of chicken.... again?
I don't know it just seems like more kabuki theater.
Last edited:
TheRealZed
Retired Sailor
- Messages
- 3,002
- Reaction score
- 3,606
- Points
- 298
How come it is we're geniuses here and knew it was pointing that way a long while ago and they're just figuring it out?
They absolutely know that we are going into recession. However... Deeply ingrained in the feds ideology is the belief that if the people think things are bad then things will be bad. They seem to believe that expectations trump fundamentals. This paints them into the corner of always having to lie about expectations if they are negative.
One of the other issues that was pointed out the other day on a podcast is that the United States is about 50 odd small economies as opposed to one large economy. On that basis they should give up reporting the US as a whole as it's a bit meaningless. They should actually report all of the regions and headline that data. I was surprised at the size of the disparity between areas. I thought it was a pretty valid point.
- Status
- Not open for further replies.