The Lunatic Fringe - Market and Trade Chat

Welcome to the Precious Metals Bug Forums

Welcome to the PMBug forums - a watering hole for folks interested in gold, silver, precious metals, sound money, investing, market and economic news, central bank monetary policies, politics and more. You can visit the forum page to see the list of forum nodes (categories/rooms) for topics.

Please have a look around and if you like what you see, please consider registering an account and joining the discussions. When you register an account and log in, you may enjoy additional benefits including no ads, market data/charts, access to trade/barter with the community and much more. Registering an account is free - you have nothing to lose!

This is NOT investment advice... But anyone who thinks there is a plan running and trump is in charge.

Buy yourself some BBBYQ for like a quarter. I don't care if you throw $10 into it. But I believe there is a plan in place for a restructuring buyout. The deadline for bids is looking like June 1st. Not all brokers will even allow you to buy it but if you can and know how to trade stocks it's Well worth the shot IMO.

Enjoy the Show

Is it also a Cohensidence that the debt ceiling x date is Also June 1st? And Clif has been talking about June for some time. Oh and school gets out June 1st, at least for our school...

:unsure: :coffee:
 
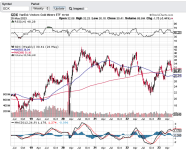
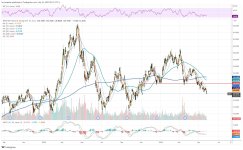
That looks like a pretty clear head and shoulders that wants to go right back to testing the $38 lows. However, that's pretty broad based and would be more indicative of recession than just PM's.
 
This is NOT investment advice... But anyone who thinks there is a plan running and trump is in charge.

Buy yourself some BBBYQ for like a quarter. I don't care if you throw $10 into it. But I believe there is a plan in place for a restructuring buyout. The deadline for bids is looking like June 1st. Not all brokers will even allow you to buy it but if you can and know how to trade stocks it's Well worth the shot IMO.

Enjoy the Show
Who'd buy BBBYQ?
 
JMO here but this couple of week metal pounding we have been experiencing feels very constructive. The PM dealer market has softened a bit but nothing too severe. We may have further down to go short term, but the overbought state of the PM market is getting worked off and complacency is returning where excitement had momentarily taken hold. Good recipe for a potential breakout as we head into the second half of the year. We c...
 
Who'd buy BBBYQ?

It's a long and complicated story that involves laws that I don't care to read. However, have a look through this twitter account. A lot of research on Reddit if you dare.


There is still a lot of value in Bed Bath and Beyond. Whether or not any shareholders will receive some of it is the question. i think they have designed it for them to participate.
Hmmm, checked out his twtr account... must be buried deep?
 
Hmmm, checked out his twtr account... must be buried deep?

Well, none of these guys are coming out and saying anything publicly / straightforward. Because then they could be accused of stock manipulation. They really are using Meme's for communication ( I believe someone said Learn our Coms).

I don't know who exactly wants to buy it but several have been linked inc. Ryan Cohen (had purchased a bunch of stock and then sold it), Carl Icahn (who recently has been attacked by the cabal) but used to do this all the time buying things in BK, and this guy maybe through some other companies.

If you really want to dig then you have to go to the Reddit page.


Things like this that just don't seem like a coincidence.

1684947512520.png
 
Last edited:
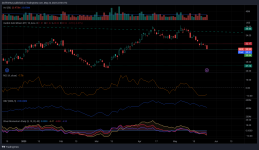
I know it feels counter intuitive but the GDX Rate Of Change is looking up suggesting that GDX is working out a bottom around these parts. Decent support/resistance has historically kicked in @ around 30. Given that, the next rally really needs to exceed 6pts to be convincing, otherwise we maybe in dead cat bounce territory. Currently we are @ a ~50% retrace of the last rally, this is normally enough to bring the bulls back out to play. The last bottom was a double so expect some argy-bargy. Weekly ROC, Momentum levels are near recent history buy levels and On Balance Volume is still looking OK on the weekly. Weekly STO and RSI are into buy the dip territory IF we are in bull mode, otherwise they suggest a few more weeks of struggle before any relief. Daily STO and RSI are in short term buy mode, AKA look for an entry short term, a low of some sort should be near. The strength of the next rally will be telling... but watch for that double/triple bottom action.

My 2c

GDX_2023-05-25_08-58-13.png
 
Maybe the OTC BK stock is not your style... what do you think about buying some IEP? It's gone from $50's to $18. It was paying $8 / year in dividends. I do think it was overvalued but I sold a couple puts. Got killed on the one in my margin account but rolled it down. Wouldn't mind some of those shares.
 
This sell-off in the mining shares is flashing a red flag for me. It's like it's April 2022 all over again - failed breakout everyone rush to the exit.

With gold holding so closely to it's all-time highs, the miners SHOULD be holding firm, or even moving higher. This flash crash makes you wonder.
 
Maybe the OTC BK stock is not your style... what do you think about buying some IEP? It's gone from $50's to $18. It was paying $8 / year in dividends. I do think it was overvalued but I sold a couple puts. Got killed on the one in my margin account but rolled it down. Wouldn't mind some of those shares.
The dividend was very nice on that. I never owned it but for a long time it traded 45-50's and back down after dividend. On the weekly it averaged about 1-2 million shares a week. Last few weeks it's been huge selling. 57 million plus one week, then 23, 10 and now 25 mil plus.. Not sure where the bottom is in that one and I haven't followed it to see why. Just earnings misses for last few 1/4's it looks like. It does look cheap compared to the last several years though. I dont know enough about the company to take chance on a turnaround yet.
 
This sell-off in the mining shares is flashing a red flag for me. It's like it's April 2022 all over again - failed breakout everyone rush to the exit.

With gold holding so closely to it's all-time highs, the miners SHOULD be holding firm, or even moving higher. This flash crash makes you wonder.
I've been looking for an exit for my ZSL (Silver short) It's done well over the last few weeks. Silver still looks weak to me though. 22.50 and maybe even 21.50 may be in the cards. So for now I will hold but if I see signs of a reversal I'll dump it.
 
FYI

They’re Taking the System and America Down – Bill Holter​

39m
 
Who's taking down which system? Kinda the important thing. Perhaps we are allowing the bankers to take their system down as it is dying anyway. Then we shall see.
 
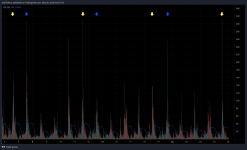
15 minutes of selling @ between ~19 times the average 15 minute volume for the day for a ~1.25% ~$25 price drop. Then we short covered for a 40 mins and $15.50. Once the hot hands left the crowd (OBV) drifted slowly lower for the rest of the day. Setting the scene for Friday...

1. A smash into the weekend.

or

2. Some professional covering working the Friday nerves, squeezing out the crowd that don't have the stomach to hold over the weekend.

GC 15 min, the last few Comex volume spikes Thursday (Yellow) v Friday (Blue).

GC1!_2023-05-26_10-43-54.png
 
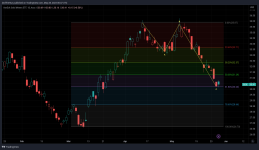
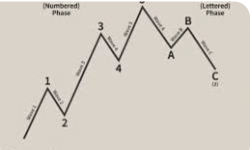
So far GDX daily looks to me to be in a classic ABC correction pattern, near as you get in my experience. EW guru's can chime in with a correction if warranted! 61.8% is about the limit for correction depth in an ideal world. Rally next week?

View attachment 8746

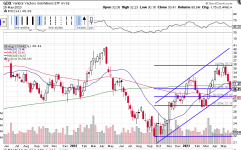
I think that's too narrowed in, although everything is fractal so I think its some child wave count that should probably still hold. Also, for a pullback should you not measure bottom up? On a little bit longer time frame the Weekly chart looks good. Right at the 38% correction and the bottom of the up trend lines. We did break the 180-200 week support which I would have liked to hold But the 18 week is just about to cross up on the 180 week, similar to a golden cross. RSI is still much better than the last few bottoms giving some bullish divergence.

1685292371329.png
 
Agree that this may be an ABC completing. Also agree with Voodoo that it helps to pull the lens back longer term for some additional context. Ideally, if I was trying to do this rigorously (I stopped trying long ago because I couldn't convince myself that what I was doing wasn't a moving target that at least partially moved based on how I chose to see and label things), I would step way back and try to find the super cycle and all the divided sub cycles therein. That being said, this could possible be an ABC down of a wave two based on Voodoo's chart. That would mean if and when we turn the corner we start a wave 3 impulse, which should have legs. Here is an idealized impulse up with completed correction:

screenshot_290.png
 
Also, for a pullback should you not measure bottom up?

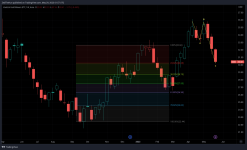
I don't do it that way, it's a 61.8% discount/retrace of the full measured move. I don't see how you could do it the other way. For easy math in rough numbers we did 26.5 to 36.5 for 10pts. A 61.8% retrace means giving up 6.18 of those points bringing you back to ~30.32. (36.5 - 6.18) as the chart displays.

Doing it the other way you get a retracement to 38.2% of the move as apposed to a 61.8% retracement.

Do it which ever way you like but I prefer to look at it in terms of % of the move given up.

I guess so long as you are consistent in your approach it won't matter.

Agree that this may be an ABC completing.

It looks to me to meet the 'rules', although not clear I can see the 5 wave fractals in each move. Must admit I didn't spend that much time on it. The fractals might be clearer if I drop to a 1-4hr type of time frame.

I think that's too narrowed in

Well, if it's clear on a daily chart that is long term for a good chunk of this market... LOL!
 
Weekly GDX, on a closing basis the first retractment got close to 61.8% as well... just saying. Not very clear to me what the EW structure was on that down move.GDX_2023-05-29_11-57-49.png
 
 
Weekly GDX, on a closing basis the first retractment got close to 61.8% as well... just saying. Not very clear to me what the EW structure was on that down move.View attachment 8769

I would not move backwards on the chart. If I want to measure a pull back in a bull market I'd go from the low and up and to the right. In a Bear Market I'd go down and to the right. But never left/backwards in time.
 
I would not move backwards on the chart. If I want to measure a pull back in a bull market I'd go from the low and up and to the right. In a Bear Market I'd go down and to the right. But never left/backwards in time.

I measure in the direction of the move I'm accessing, always 0 to 100 from the start of the move, down moves 0 is high, up moves 0 is low. e.g. All trend extension projections start with the 0 low. I'm measuring a historic move so going back in time is correct, we know the start and end point, measuring it that way won't violate any technical principle.

Besides the other way gives you the wrong answer. A 38.2% retracement in your world means you've' lost 61.8% of the gain. Doing it my way it means you have lost 38.2% of the gain. For all of my technical trading career a retracement has always been expressed as a percentage of the previous move, or the move being measured. Starting with 100 high simply delivers the wrong number in all cases except 50% moves!
 
Weekly GDX, on a closing basis the first retractment got close to 61.8% as well... just saying. Not very clear to me what the EW structure was on that down move.View attachment 8769
Not clear to me where we would be on EW count with GDX. We have been contained within the low and high from 2020 for almost three years now...

screenshot_291.png
 
I measure in the direction of the move I'm accessing, always 0 to 100 from the start of the move, down moves 0 is high, up moves 0 is low. e.g. All trend extension projections start with the 0 low. I'm measuring a historic move so going back in time is correct, we know the start and end point, measuring it that way won't violate any technical principle.

Besides the other way gives you the wrong answer. A 38.2% retracement in your world means you've' lost 61.8% of the gain. Doing it my way it means you have lost 38.2% of the gain. For all of my technical trading career a retracement has always been expressed as a percentage of the previous move, or the move being measured. Starting with 100 high simply delivers the wrong number in all cases except 50% moves!

Doing it the other way is only for a retracement in a Bear market, ie a bounce and would be used as if you were short.
 
Now that the debt ceiling issue has been handled, attention will focus on inflation data (as an indicator on future Fed action). To wit:
Inflation stayed stubbornly high in April, potentially reinforcing the chances that interest rates could stay higher for longer, according to a gauge released Friday that the Federal Reserve follows closely.

The personal consumption expenditures price index, which measures a variety of goods and services and adjusts for changes in consumer behavior, rose 0.4% for the month excluding food and energy costs, higher than the 0.3% Dow Jones estimate.

On an annual basis, the gauge increased 4.7%, 0.1 percentage point higher than expected, the Commerce Department reported.

Including food and energy, headline PCE also rose 0.4% and was up 4.4% from a year ago, higher than the 4.2% rate in March.
...

 
First, the debt ceiling thing has NOT been handled. They did throw out a shitty bill without any vote yet.

Also, I did pick up some more BBBYQ and sold a little GME to do it. The ratio got over 100:1 so i sold 20 GME to try and get 2000 but only got filled on 1000. So i bought more junior silver miner, KUYAF instead. :unsure:
 
Back
Top Bottom